When examining #GOLD for the trading week of April 29 to May 3, 2024, several indicators may suggest a potential increase in quotations and prices.…
Author: GOLD Signals TEAM
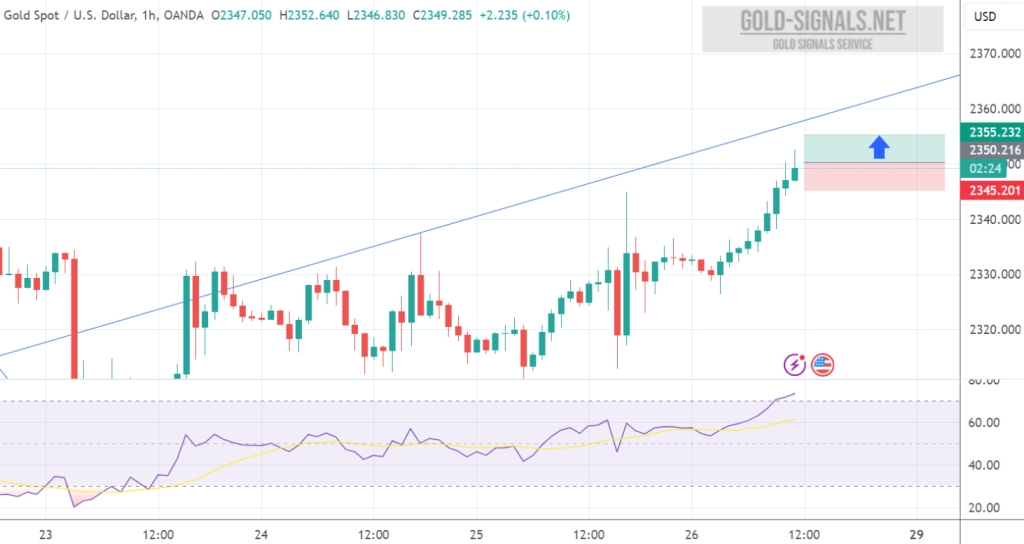
BUY at 2351.00 T/P: 2356.00 S/L: 2346.00 #XAUUSD hit S/L Price with -500 PIPs Loss
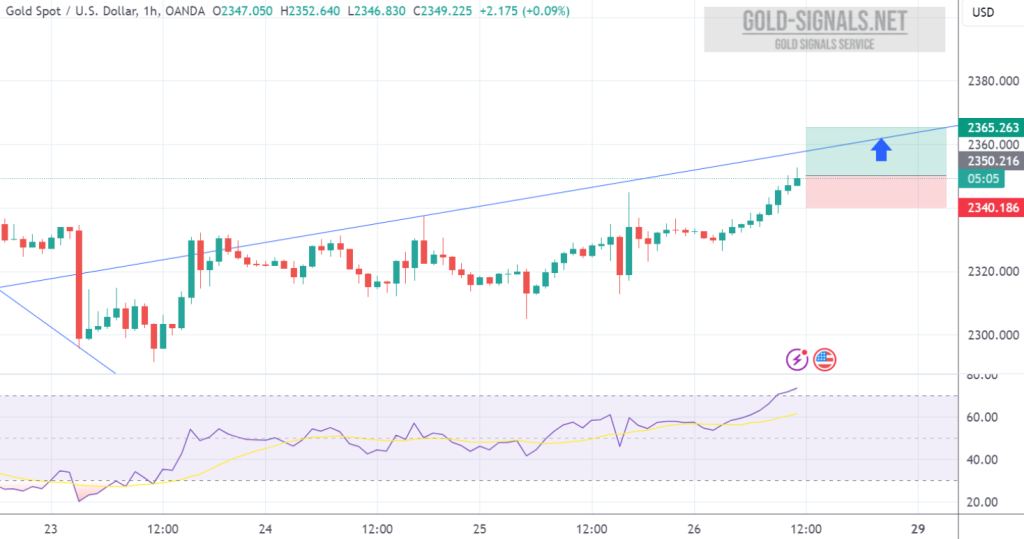
BUY at 2350.00 T/P 1: 2355.00 T/P 2: 2360.00 T/P 3: 2365.00 S/L: 2340.00 #XAUUSD hit S/L Price with -1.000 PIPs Loss
Technical Analysis of XAU/USD Summary: Based on the analysis of oscillators, moving averages, pivot points, and the gold forecast, XAU/USD presents a predominantly bullish…
When considering #GOLD, a potential downturn in quotes could manifest through a variety of signals. Firstly, a significant indication might be the testing of the…
Technical Analysis of XAU/USD Summary: Based on the analysis of oscillators, moving averages, pivot points, and the gold forecast, XAU/USD presents a mixed outlook.…
In the realm of #GOLD, additional signs pointing towards a potential decline in quotes may arise from testing the resistance line on the relative strength…
Technical Analysis of XAU/USD Summary: Based on the analysis of oscillators, moving averages, pivot points, and the gold forecast, XAU/USD presents a predominantly bullish outlook.…
In the domain of #GOLD, signs indicating a potential decline in quotes could stem from testing the resistance line on the relative strength index (RSI)…
Based on oscillators, moving averages, pivot points, and the gold forecast, XAU/USD presents a mixed outlook. While some indicators signal buying opportunities, others advise caution…