A potential sell signal in XAU/USD arises from the test of the resistance line on the RSI indicator. A second confirmation comes from a rebound…
Author: GOLD Signals TEAM
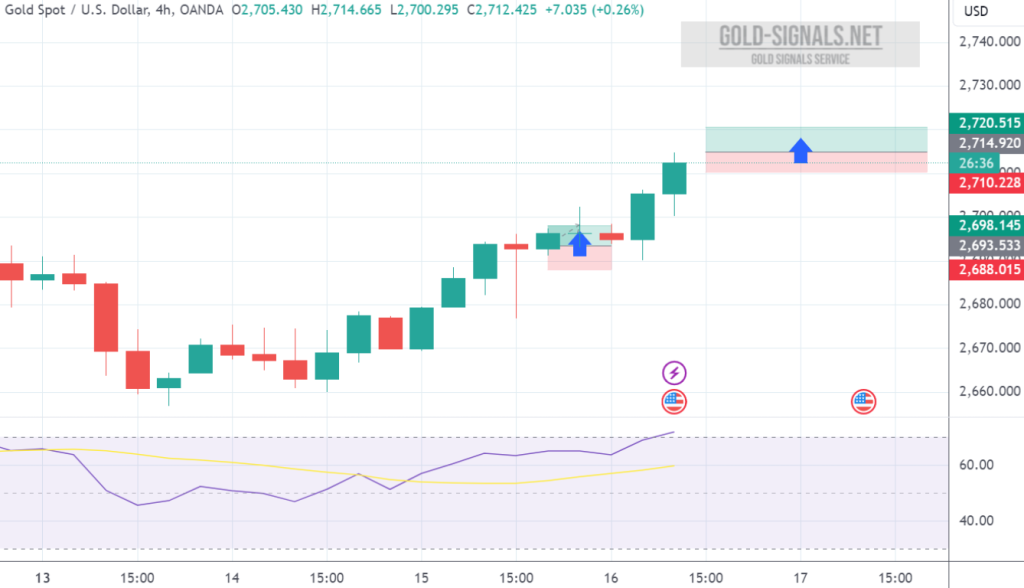
BUY at 2714.50 T/P: 2719.50 S/L: 2709.50 #XAUUSD hit T/P Price with +500 PIPs Profit
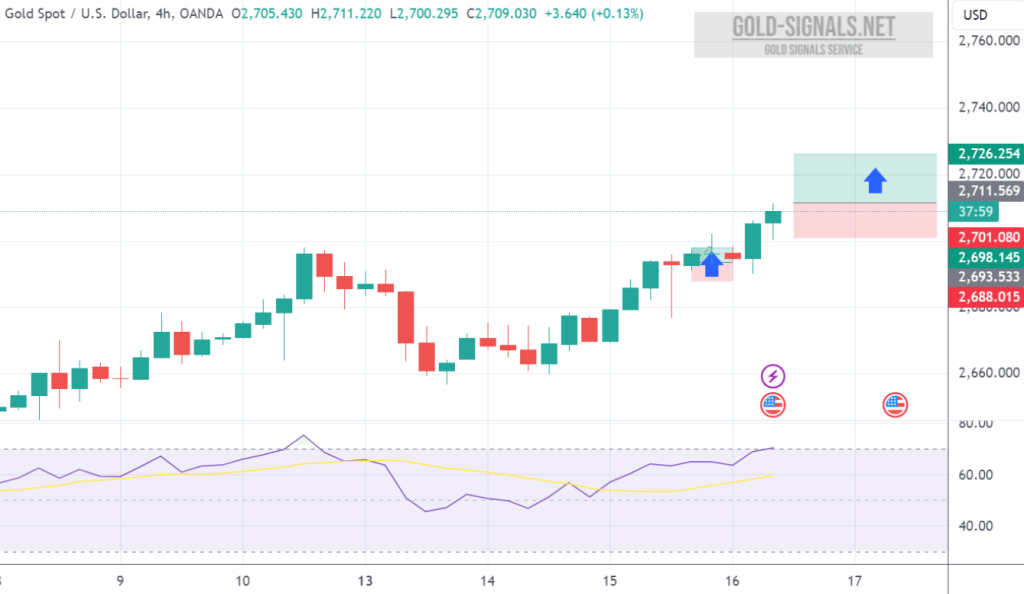
BUY at 2711.00 T/P 1: 2716.00 T/P 2: 2721.00 T/P 3: 2726.00 S/L: 2701.00 #XAUUSD hit T/P 3 Price with +1.500 PIPs Profit
Current Price: 2703.42 Time: 2025-01-16 12:50:05 Oscillators 1H: BUY: MACD Level SELL: Commodity Channel Index, Momentum NEUTRAL: RSI, Stochastic %K, ADX, Awesome Oscillator, Stochastic RSI…
An additional signal supporting the potential decrease in XAU/USD prices is the test of the resistance line on the RSI indicator. Another bearish confirmation comes…
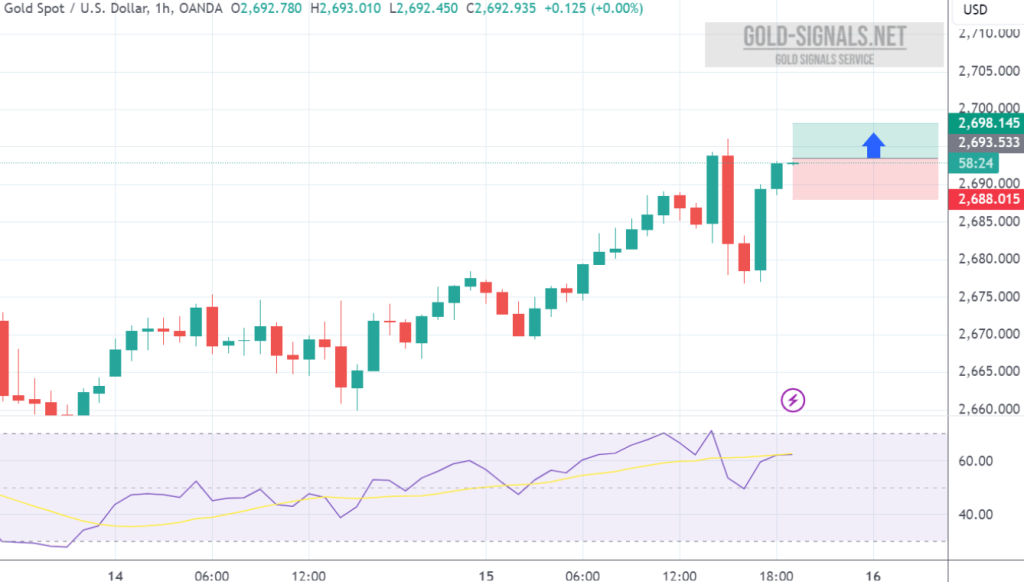
BUY at 2693.50 T/P: 2698.50 S/L: 2688.50 #XAUUSD hit T/P Price with +500 PIPs Profit
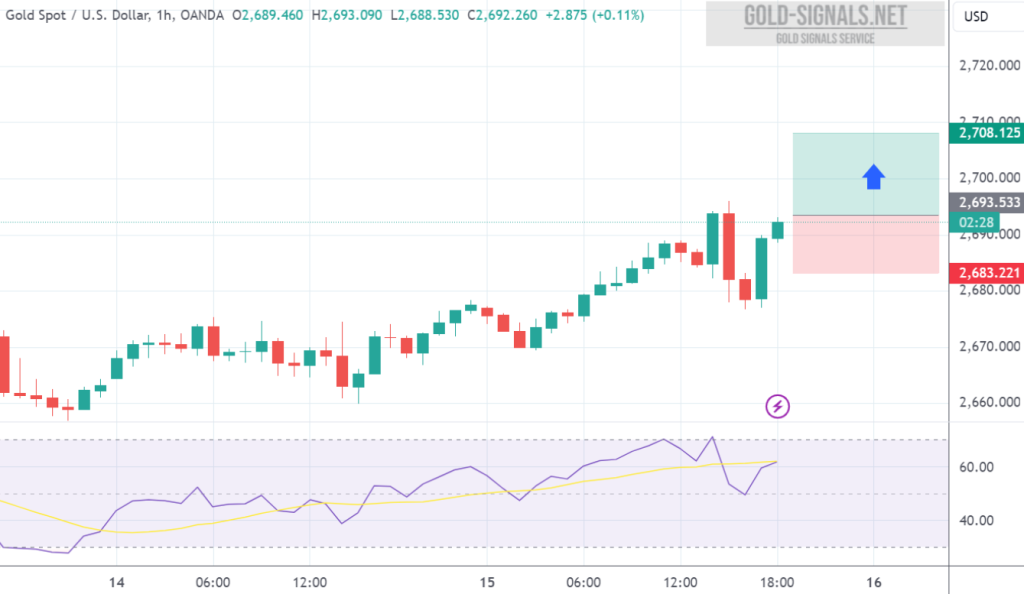
BUY at 2693.00 T/P 1: 2698.00 T/P 2: 2703.00 T/P 3: 2708.00 S/L: 2683.00 #XAUUSD hit T/P 3 Price with +1.500 PIPs Profit
Current Price: 2681.98 Timeframe 1 Hour: Oscillators: Neutral mix of signals with some leaning bullish (Momentum, Bull Bear Power) Moving Averages: Mixed bag with some…
Current Price: 2685.61 (as of January 15, 2025, 10:30 AM PST) Timeframe: 1 hour and 4 hour Overall: The technical analysis of Gold (XAUUSD) is…
A potential decline in XAU/USD is indicated by the RSI testing the resistance line. Another sign supporting this downward movement is a rebound from the…