The technical analysis for #GOLD on the 1-hour chart presents a mixed outlook. While some indicators signal a BUY sentiment, including momentum and certain moving…
Author: GOLD Signals TEAM
Technical Analysis for XAU/USD (Gold) – 1-Hour Chart Summary: Oscillators: BUY: Momentum, MACD Level, Bull Bear Power Neutral: Relative Strength Index, Stochastic %K, Commodity Channel…
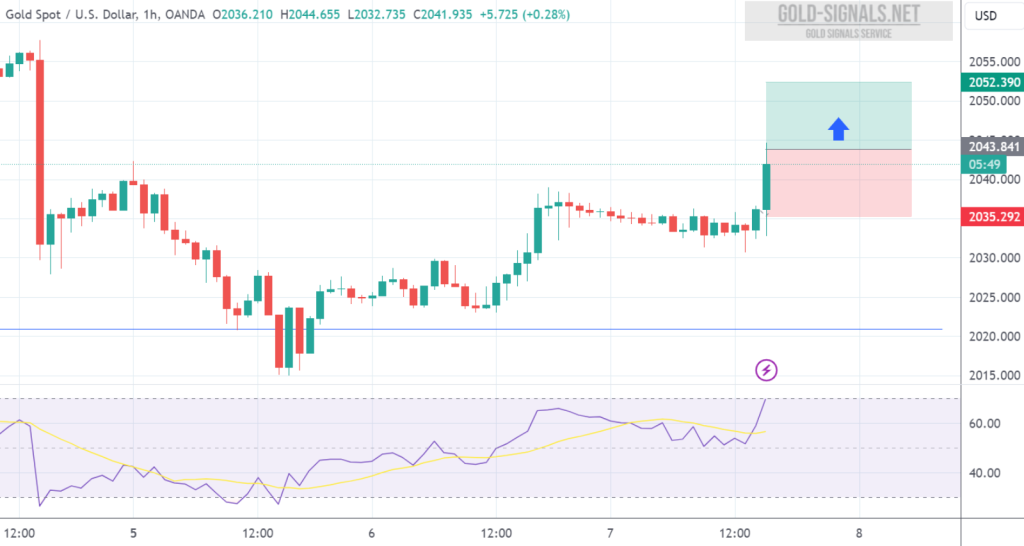
BUY at 2043.00 T/P 1: 2048.00 T/P 2: 2053.00 S/L: 2033.00 #XAUUSD Update: Cancelled
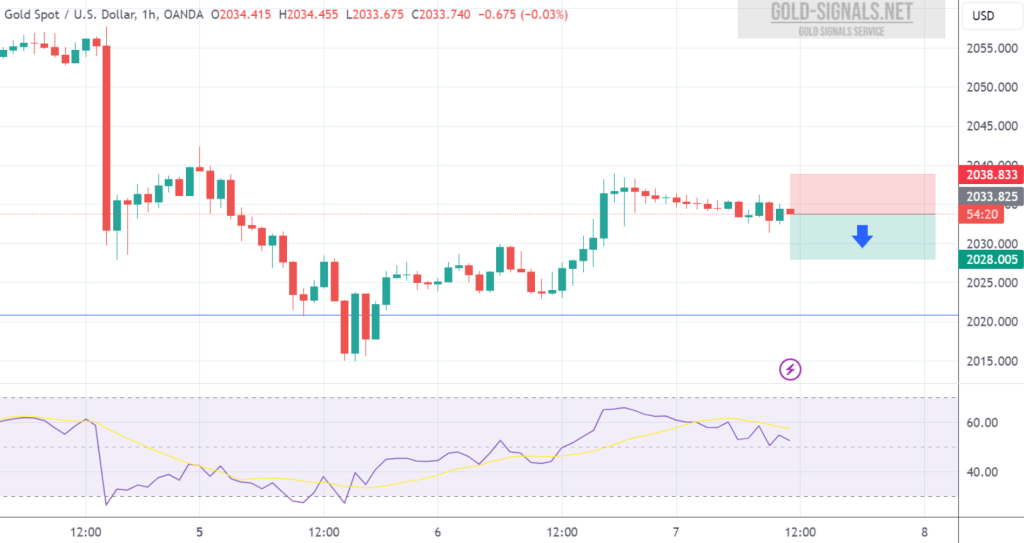
SELL at 2033.00 T/P: 2028.00 S/L: 2043.00 #XAUUSD hit S/L Price with -500 PIPs Loss
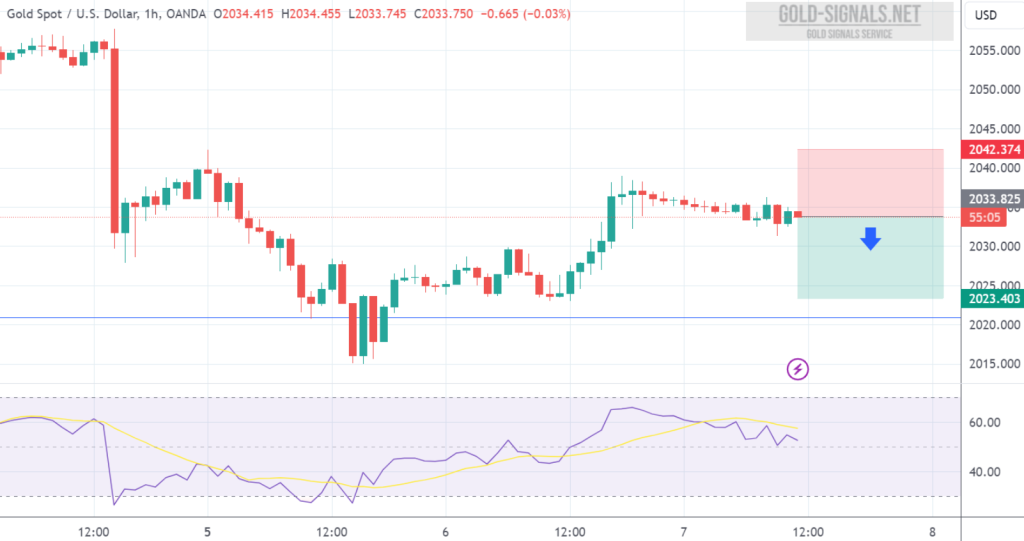
SELL at 2033.00 T/P 1: 2028.00 T/P 2: 2023.00 S/L: 2043.00 #XAUUSD hit S/L Price with -1.000 PIPs Loss
Technical Analysis for XAU/USD (Gold) – 1-Hour Chart Summary: Oscillators: BUY: Momentum (10), Bull Bear Power SELL: MACD Level (12, 26) Neutral: Relative Strength Index,…
Look for RSI support line test and bullish channel rebound signaling potential growth. A drop below 1995 on February 6, 2024, indicates support breakdown, potentially…
In today’s volatile financial landscape, finding a trustworthy signals provider is paramount to success in the GOLD market. However, with the rise of fraudulent schemes…
Uncover the Secrets of Success with GOLD Signals Strategy from GOLD-Signals.net Are you ready to elevate your trading game and unlock the full potential…
Unlock the Power of GOLD Signals Software for Enhanced Trading Success Are you seeking a cutting-edge solution to optimize your trading performance in the GOLD…