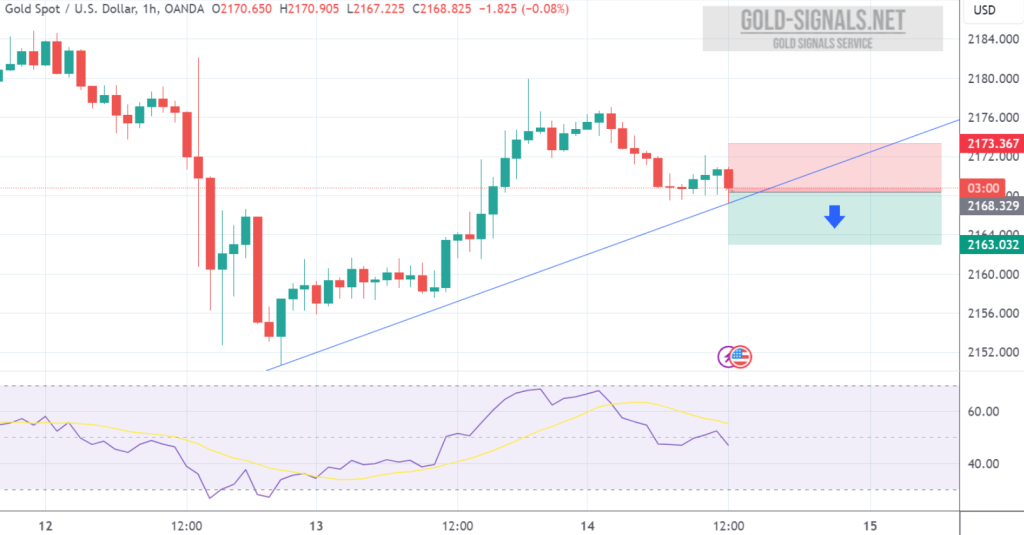
SELL at 2168.00 T/P: 2163.00 S/L: 2173.00 #XAUUSD hit T/P Price with +500 PIPs Profit
Author: GOLD Signals TEAM
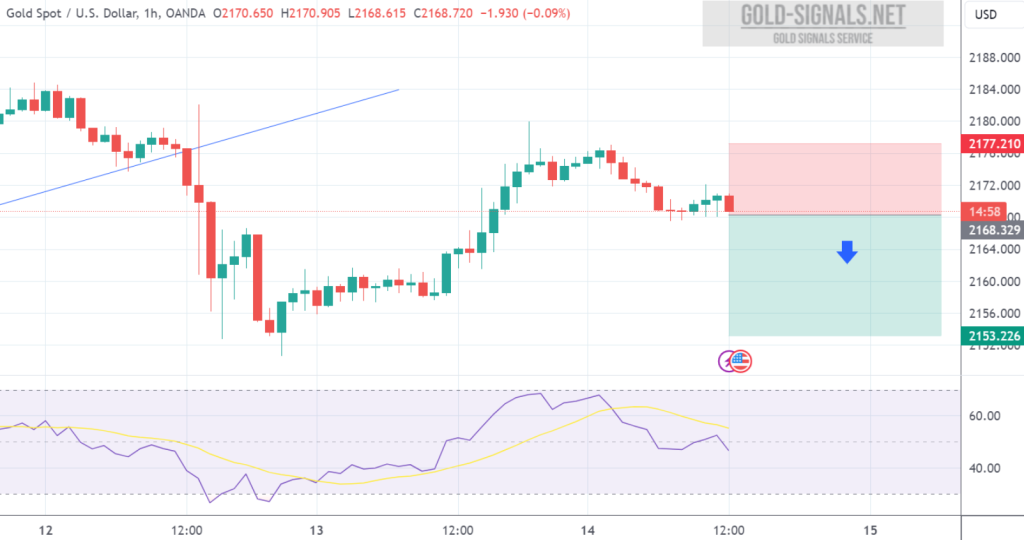
SELL at 2167.00 T/P 1: 2162.00 T/P 2: 2157.00 T/P 3: 2152.00 S/L: 2177.00 #XAUUSD hit T/P 3 Price with +1.500 PIPs Profit
Technical Analysis for XAU/USD on 1-Hour Chart Oscillators Summary: Buy: Bull Bear Power Sell: Momentum, MACD Level Neutral: Relative Strength Index (RSI), Stochastic %K,…
An additional indicator supporting the upward movement in GOLD prices would involve testing the support line on the relative strength index (RSI). Another sign would…
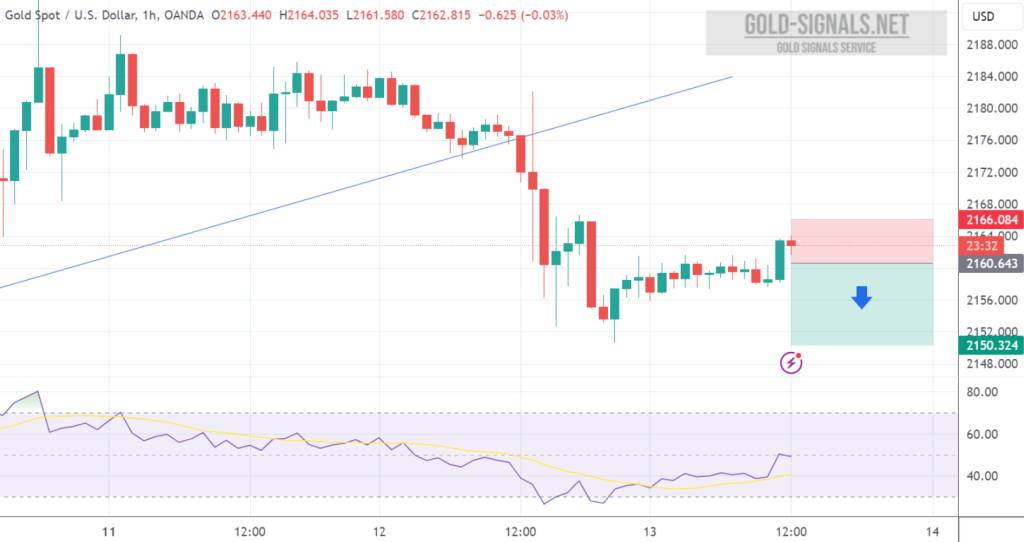
SELL at 2160.00 T/P 1: 2155.00 T/P 2: 2150.00 S/L: 2170.00 #XAUUSD hit T/P 2 Price with +1.000 PIPs Profit
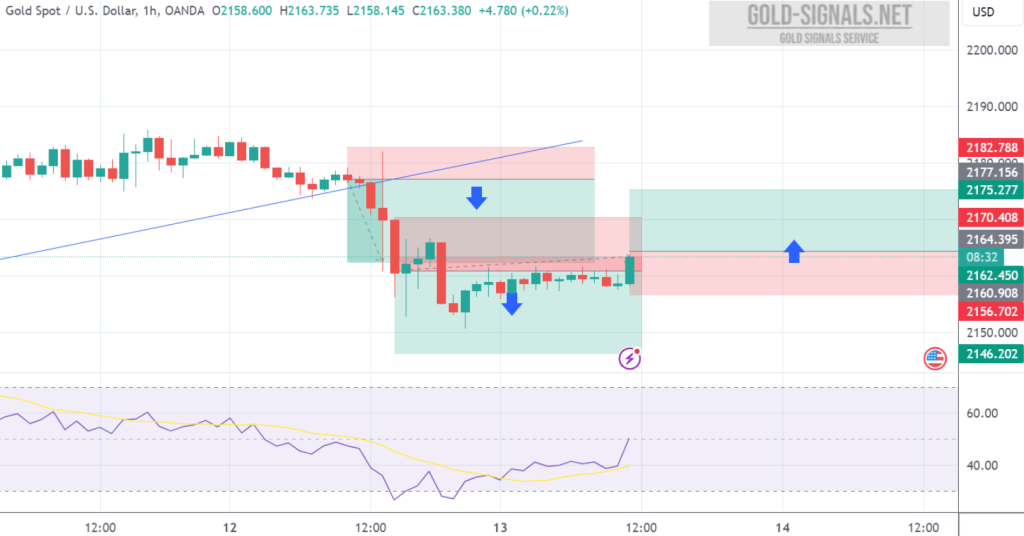
BUY at 2164.00 T/P 1: 2169.00 T/P 2: 2174.00 S/L: 2154.00 #XAUUSD hit T/P 2 Price with +1.000 PIPs Profit
Technical Analysis for XAU/USD (Gold Market) Current Price: $2159.43 (as of 08:48 AM) OSCILLATORS Summary: BUY: MACD Level (12, 26) SELL: Momentum (10) Market Direction:…
Another indication supporting the rise in XAUUSD rates would be a trial of the support line on the relative strength index (RSI). A secondary indication…
Technical Analysis for XAU/USD (Gold Market) Current Price: $2163.53 (as of 16:24 PM) OSCILLATORS Summary: BUY: Commodity Channel Index (20), Momentum (10) SELL: MACD Level…
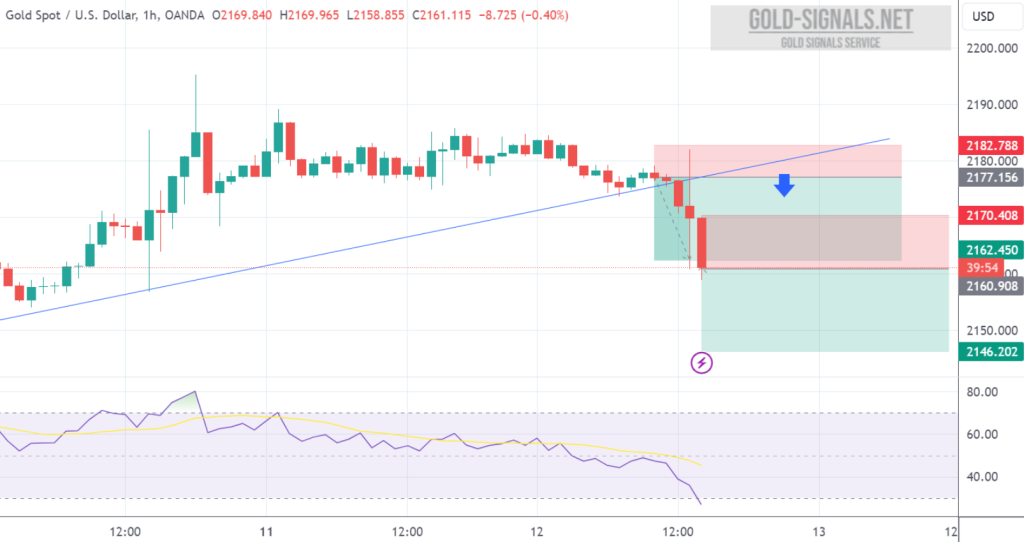
SELL at 2161.00 T/P 1: 2156.00 T/P 2: 2151.00 T/P 3: 2146.00 S/L: 2171.00 #XAUUSD hit T/P 2 Price with +1.000 PIPs Profit