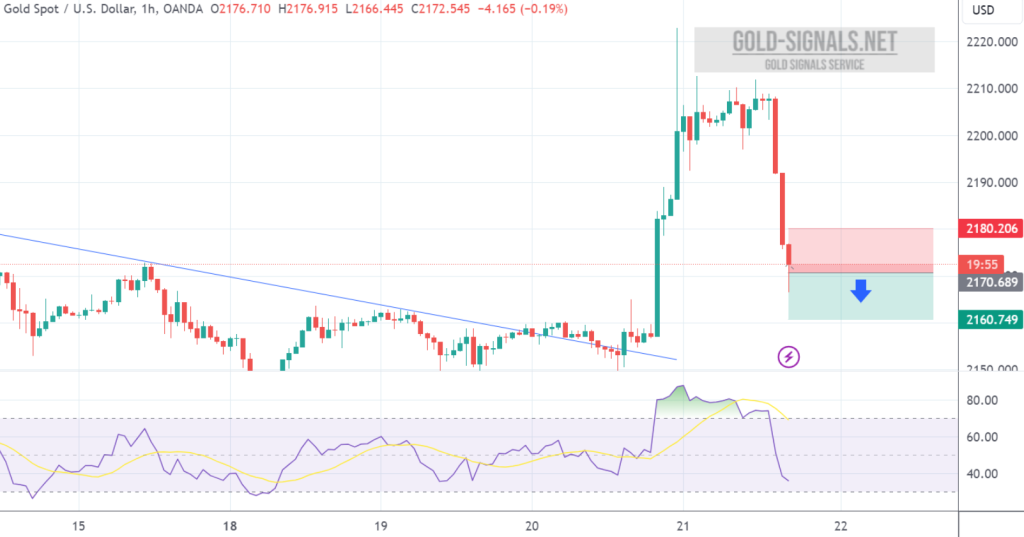
SELL at 2170.00 T/P 1: 2165.00 T/P 2: 2160.00 S/L: 2180.00 #XAUUSD hit S/L Price with -500 PIPs Loss
Author: GOLD Signals TEAM
Technical analysis of XAU/USD on the 1-hour chart suggests a mixed sentiment. While some oscillators signal a BUY, others indicate a SELL, resulting in a…
Technical Analysis of XAU/USD (1h chart) Oscillators Summary: Buy (2): CCI (20), Hull Moving Average (9) Sell (9): RSI (14), Stochastics %K (14, 3, 3), Commodity Channel…
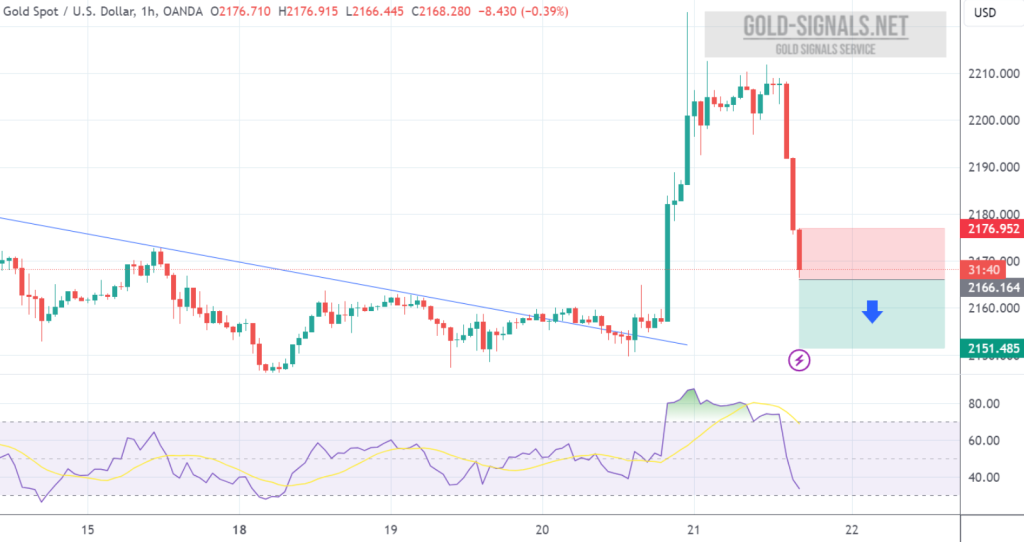
SELL at 2166.00 T/P 1: 2161.00 T/P 2: 2156.00 T/P 3: 2151.00 S/L: 2176.00 #XAUUSD hit S/L Price with -1.000 PIPs Loss
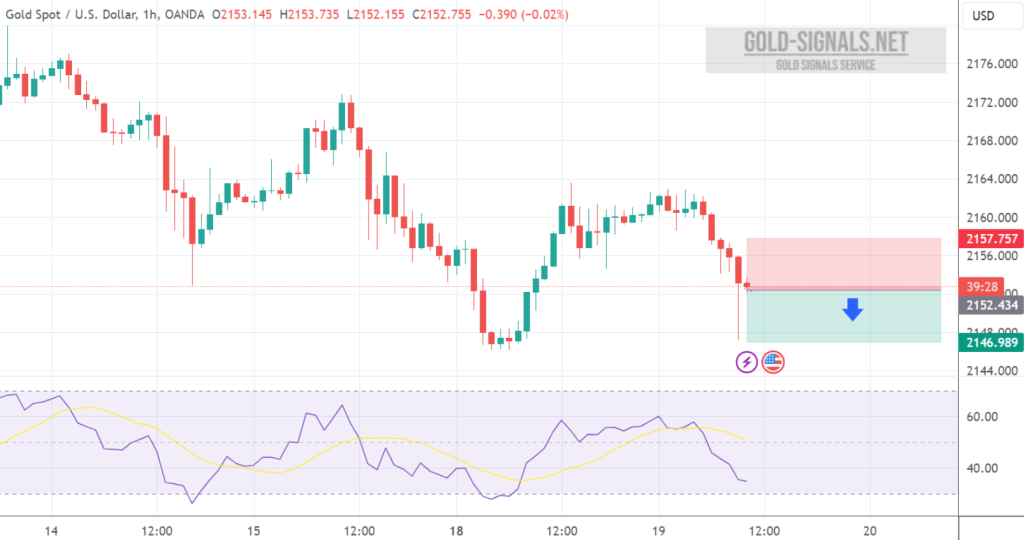
SELL at 2153.00 T/P 1: 2148.00 T/P 2: 2143.00 T/P 3: 2138.00 S/L: 2163.00 #XAUUSD hit S/L Price with -1.000 PIPs Loss
Based on the technical analysis of XAU/USD Oscillators Summary: Buy: Commodity Channel Index Sell: Awesome Oscillator, Momentum, MACD Level Neutral: Relative Strength Index, Stochastic…
Another indicator favoring an upward movement in XAU/USD rates would manifest through examining the support line on the relative strength index (RSI). A subsequent sign…
Based on the analysis of XAU/USD on the 1-hour chart, the market exhibits a neutral stance, with oscillators providing mixed signals but leaning towards selling.…
Technical Analysis for XAU/USD on 1-Hour Chart Current XAU/USD Price: 2153.67 (as of 16:43 PM) Oscillators Summary: Buy: Commodity Channel Index Sell: Awesome Oscillator,…
SELL at 2150.00 T/P 1: 2145.00 T/P 2: 2140.00 T/P 3: 2135.00 S/L: 2160.00 #XAUUSD hit S/L Price with -1.000 PIPs Loss