An additional signal indicating a potential downturn in #GOLD (#XAU/USD) quotes could stem from testing the resistance line on the relative strength index (RSI), along…
Author: GOLD Signals TEAM
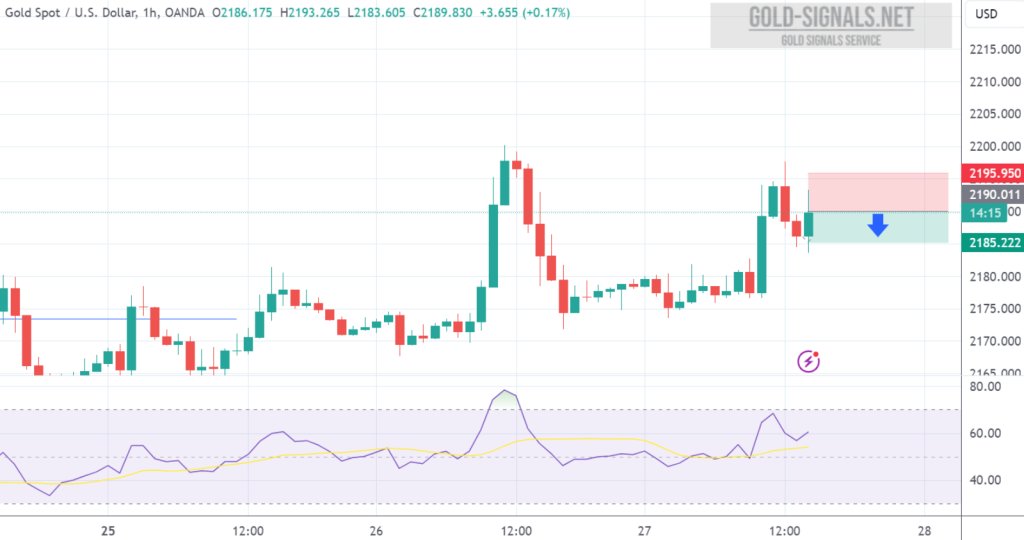
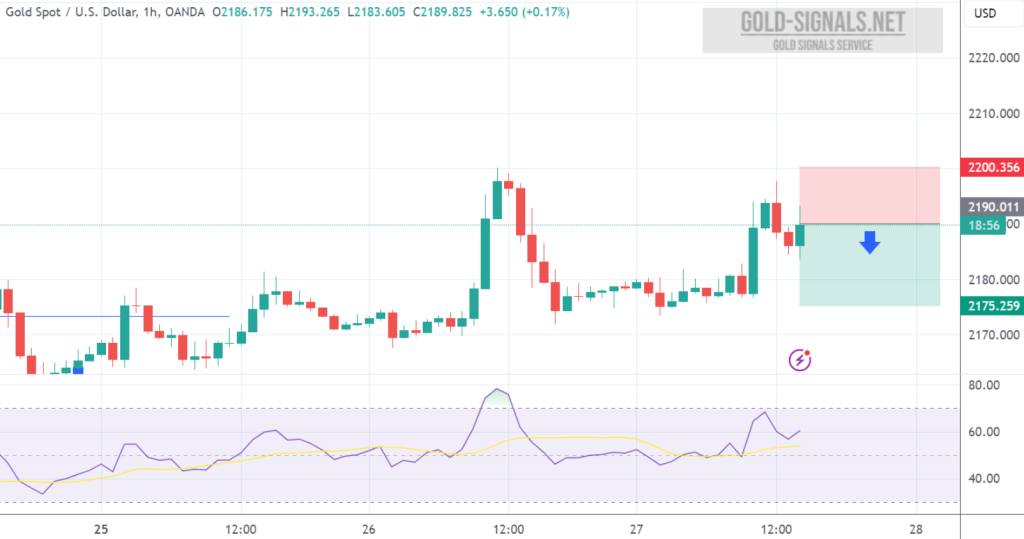
SELL at 2189.00 T/P 1: 2184.00 T/P 2: 2179.00 T/P 3: 2174.00 S/L: 2199.00 #XAUUSD Update: Cancelled
Technical Analysis for XAU/USD (Gold Market) – 1-Hour Chart Oscillators Summary: BUY: MACD Level (12, 26) SELL: Momentum (10) Oscillators present a mixed signal.…
A possible indicator for an upward trend in #GOLD (#XAU/USD) could be a trial of the support line on the relative strength index (RSI), coupled…
After falling from the resistance zone, the market continues to move sideways. #GOLD has formed an inside formation on the daily timeframe. The price was…
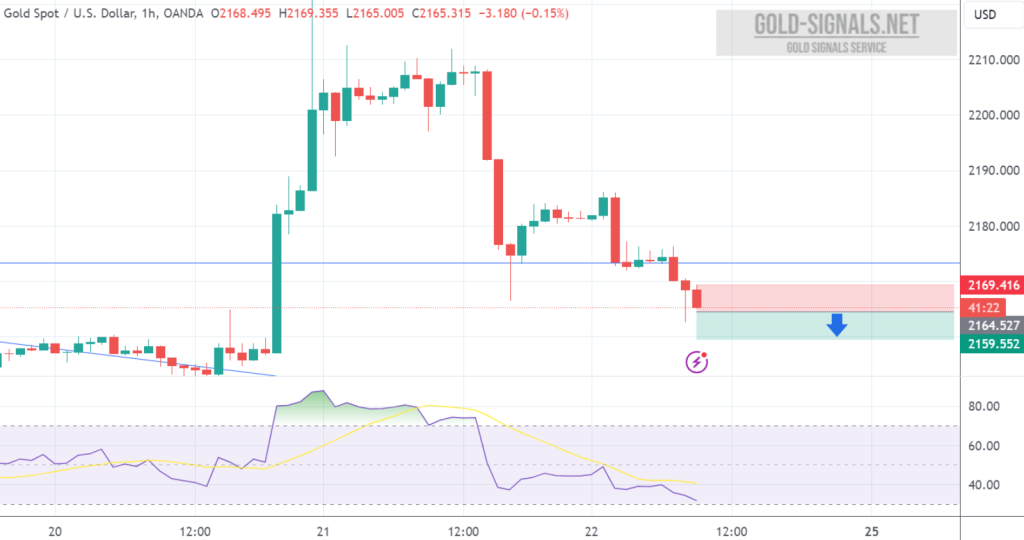
SELL at 2164.50 T/P: 2159.50 S/L: 2169.50 #XAUUSD hit S/L Price with -500 PIPs Loss
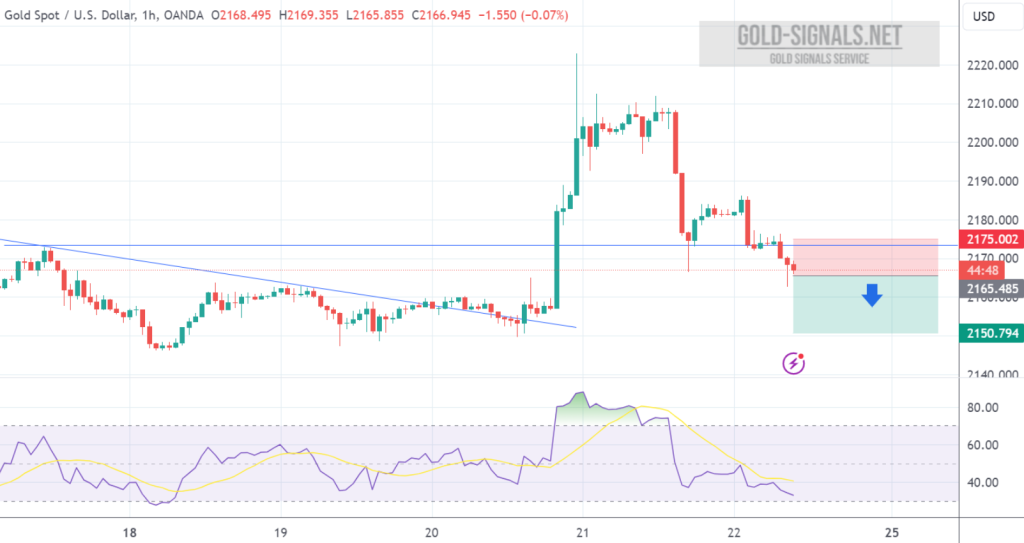
SELL at 2165.00 T/P 1: 2160.00 T/P 2: 2155.00 T/P 3: 2150.00 S/L: 2175.00 #XAUUSD hit S/L Price with -1.000 PIPs Loss
A potential catalyst for an upswing in XAU/USD rates could emerge through a trial of the support line on the relative strength index (RSI), coupled…
Technical Analysis for XAU/USD (Gold Market) – 1-Hour Chart Oscillators Summary: BUY: Williams Percent Range (14) SELL: Momentum (10), MACD Level (12, 26), Ultimate…