Total Profit in March 2024: +5.500 PIPs GOLD Signal – 1.3.2024 | T/P 2: +1.000 PIPs GOLD Signal – 1.3.2024 (FREE) | T/P: +500 PIPs…
Author: GOLD Signals TEAM
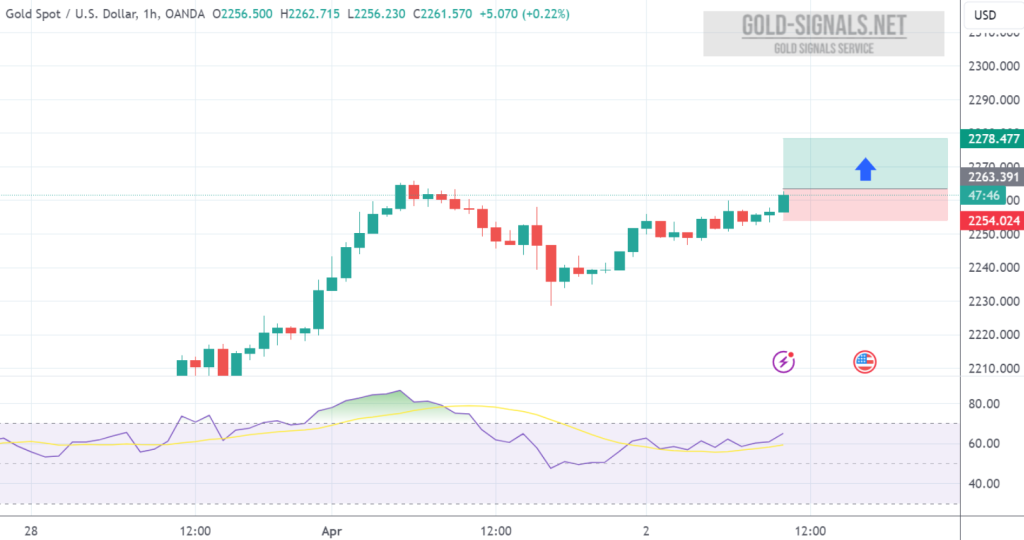
BUY at 2262.50 T/P 1: 2267.50 T/P 2: 2272.50 T/P 3: 2277.50 S/L: 2252.50 #XAUUSD hit T/P 3 Price with +1.500 PIPs Profit
Technical Analysis of XAU/USD Summary: The XAU/USD market shows mixed signals across oscillators, moving averages, and pivot points. While oscillators indicate neutrality, moving averages…
An additional signal suggesting a potential uptick in #GOLD quotes could emerge from testing the support line on the relative strength index (RSI), coupled with…
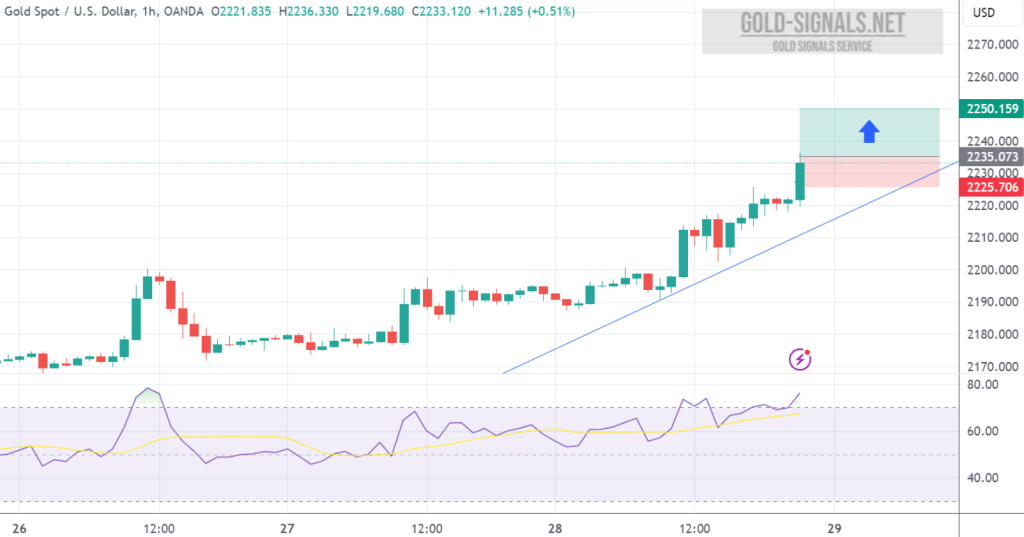
BUY at 2235.00 T/P 1: 2240.00 T/P 2: 2245.00 T/P 3: 2250.00 S/L: 2225.00 #XAUUSD hit T/P 3 Price with +1.500 PIPs Profit
The #XAUUSD market on the 1-hour chart displays mixed signals. Moving averages strongly suggest a BUY, while oscillators offer conflicting indications. Pivot points remain neutral.…
Technical Analysis for XAU/USD (Gold Market) – 1-Hour Chart OSCILLATORS: BUY: MACD Level SELL: Momentum The oscillators present a mixed signal. While the MACD…
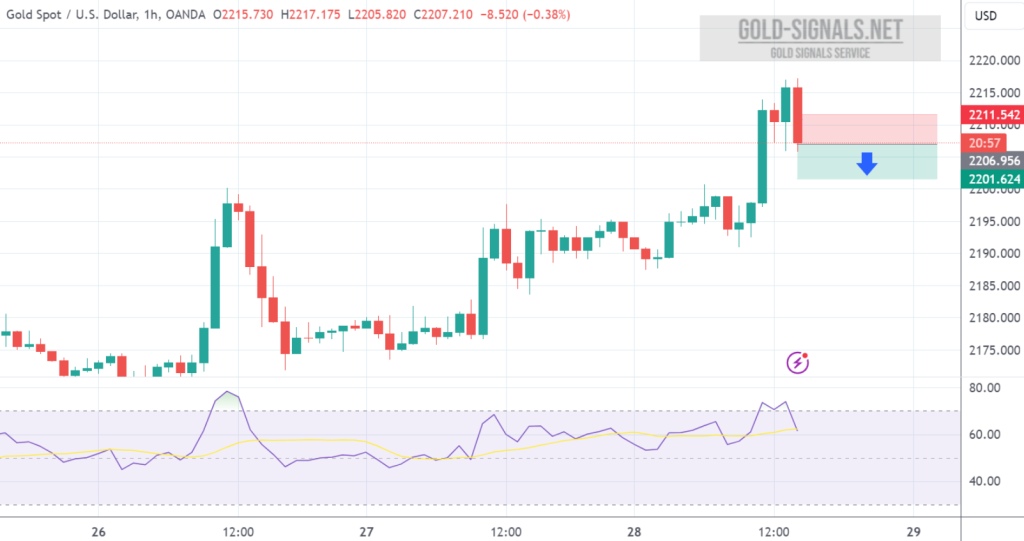
SELL at 2207.00 T/P: 2202.00 S/L: 2212.00 #XAUUSD hit T/P Price with +500 PIPs Profit

SELL at 2207.00 T/P 1: 2202.00 T/P 2: 2197.00 T/P 3: 2192.00 T/P 4: 2187.00 S/L: 2217.00 #XAUUSD hit T/P Price with +500 PIPs Profit
Technical Analysis for XAU/USD (Gold Market) – 1-Hour Chart Oscillators Summary: BUY: MACD Level (12, 26) SELL: Commodity Channel Index (20), Momentum (10) Oscillators…