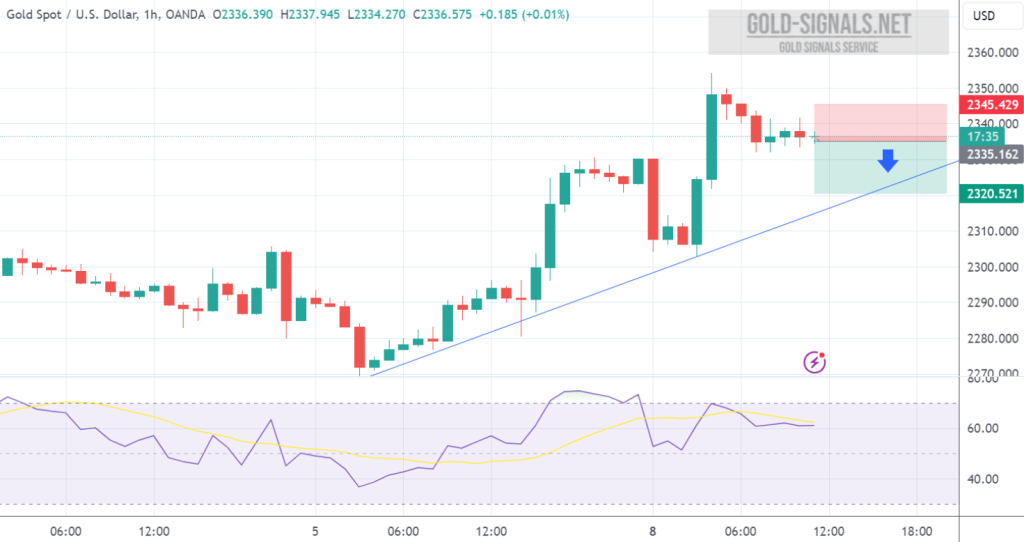
SELL at 2336.00 T/P 1: 2331.00 T/P 2: 2326.00 T/P 3: 2321.00 S/L: 2346.00 #XAUUSD hit T/P 3 Price with +1.500 PIPs Profit
Author: GOLD Signals TEAM
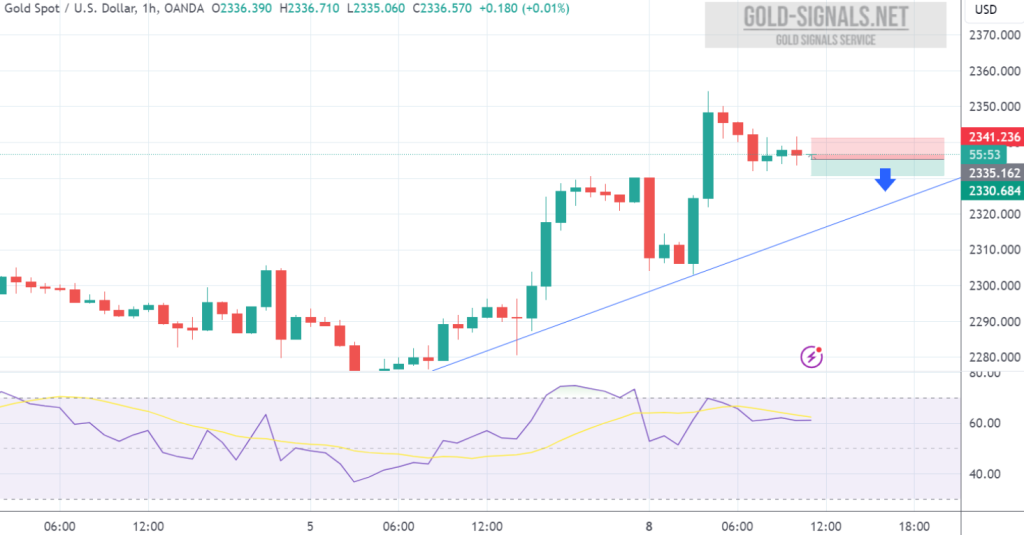
SELL at 2335.00 T/P: 2330.00 S/L: 2340.00 #XAUUSD hit T/P Price with +500 PIPs Profit
Technical Analysis for XAU/USD Summary: The technical analysis of XAU/USD suggests a predominantly bullish outlook, supported by moving averages and pivot points. Although oscillators…
In the upcoming trading week of 8th April – 12th April 2024, #GOLD could witness a potential surge in quotations and prices, driven by a…
The GOLD market shows mixed signals with oscillators leaning bearish while moving averages and pivot points suggest a bullish bias. Without a specific gold forecast,…
Technical Analysis of XAU/USD Market Summary: The XAU/USD market presents a mixed picture based on oscillators, moving averages, pivot points, and the lack of…
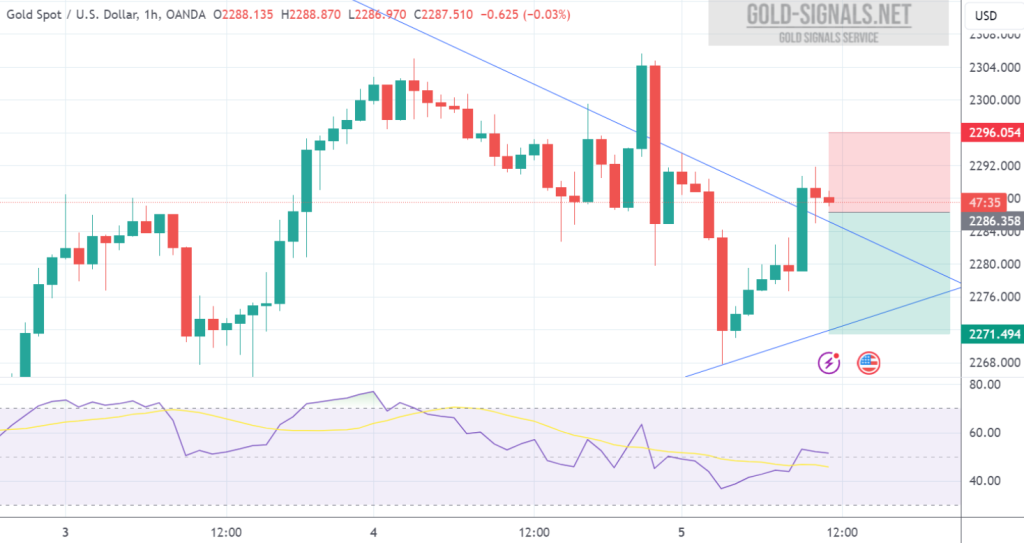
SELL at 2286.00 T/P 1: 2281.00 T/P 2: 2276.00 T/P 3: 2271.00 S/L: 2296.00 #XAUUSD hit S/L Price with -1.000 PIPs Loss
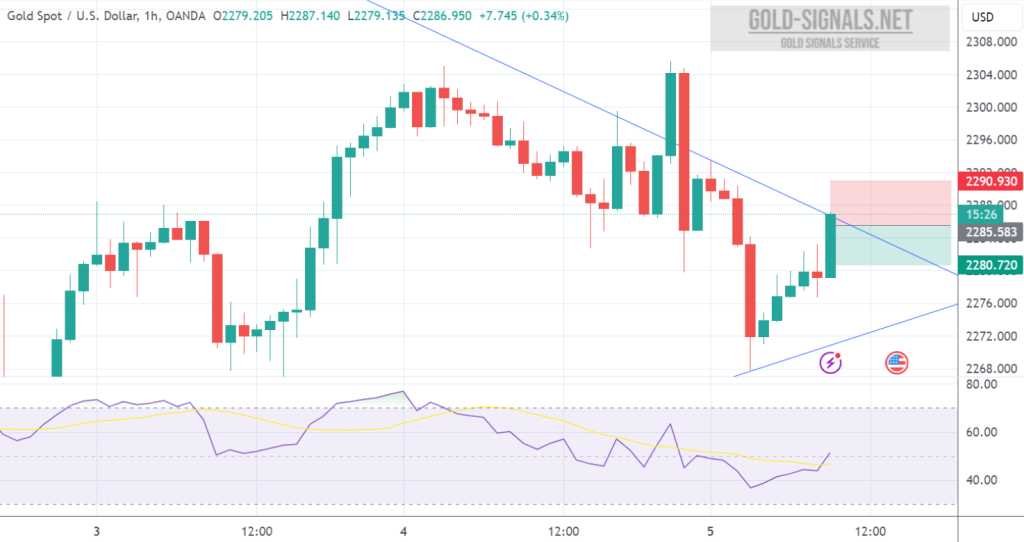
SELL at 2285.00 T/P: 2280.00 S/L: 2290.00 #XAUUSD hit T/P Price with +500 PIPs Profit
Technical Analysis of XAU/USD Market OSCILLATORS Summary: Buy Signals: MACD Level, Ultimate Oscillator Sell Signals: Relative Strength Index (RSI), Stochastic %K, Commodity Channel Index…
#GOLD market shows conflicting signals: oscillators indicate bearish sentiment, while moving averages and pivot points suggest a bullish bias. Traders should remain cautious, using a…