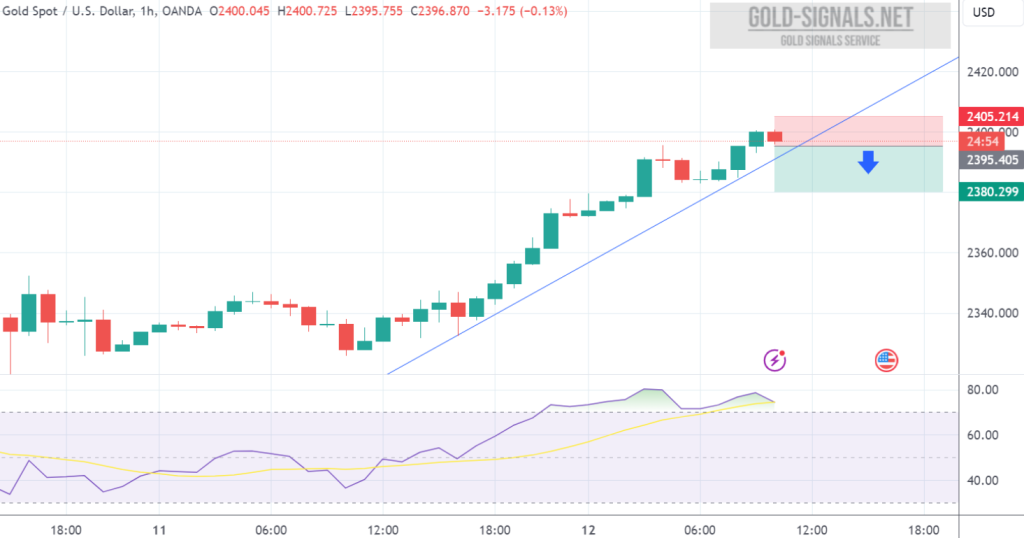
SELL at 2394.50 T/P 1: 2389.50 T/P 2: 2384.50 T/P 3: 2379.50 T/P 4: 2374.50 S/L: 2419.50 #XAUUSD hit S/L Price with -1.500 PIPs Loss
Author: GOLD Signals TEAM
#GOLD analysis reveals mixed signals: while oscillators like Awesome Oscillator and MACD Level suggest buying opportunities, indicators like RSI and CCI signal caution. However, moving…
Technical Analysis Summary for XAU/USD OSCILLATORS: Buy: Awesome Oscillator, MACD Level, Bull Bear Power Neutral: Stochastic %K, ADX, Stochastic RSI Fast, Williams %R, Ultimate…
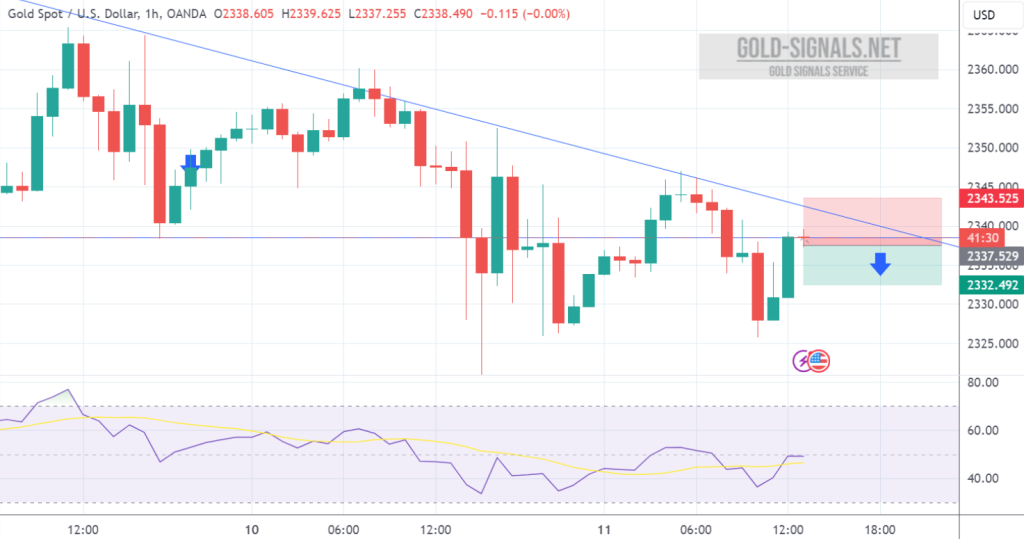
SELL at 2337.00 T/P: 2332.00 S/L: 2342.00 #XAUUSD hit S/L Price with -500 PIPs Loss
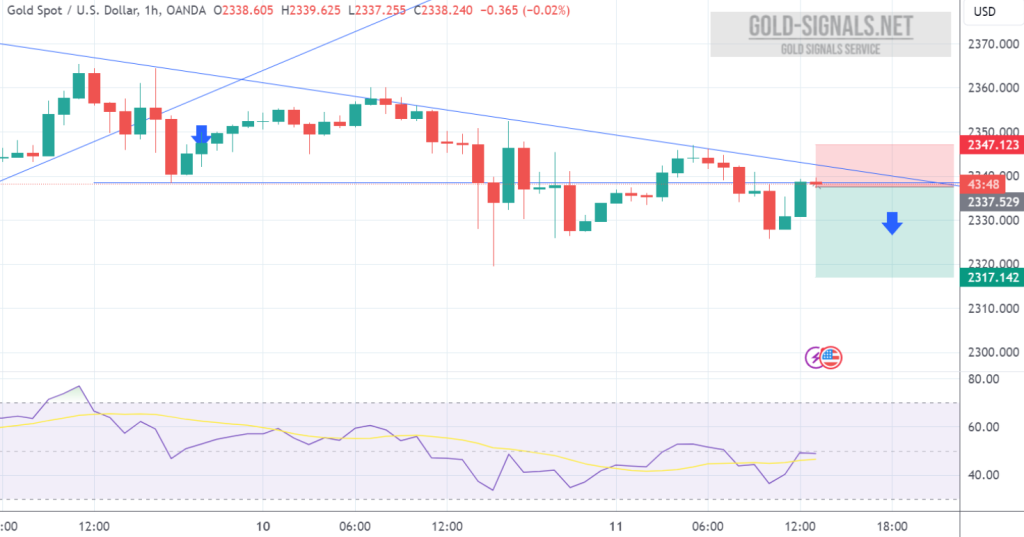
SELL at 2337.00 T/P 1: 2332.00 T/P 2: 2327.00 T/P 3: 2322.00 S/L: 2347.00 #XAUUSD hit S/L Price with -1.000 PIPs Loss
Based on the technical analysis of XAU/USD OSCILLATORS: Buy: MACD Level, Williams Percent Range, Bull Bear Power Sell: Commodity Channel Index, Momentum Direction: Mixed…
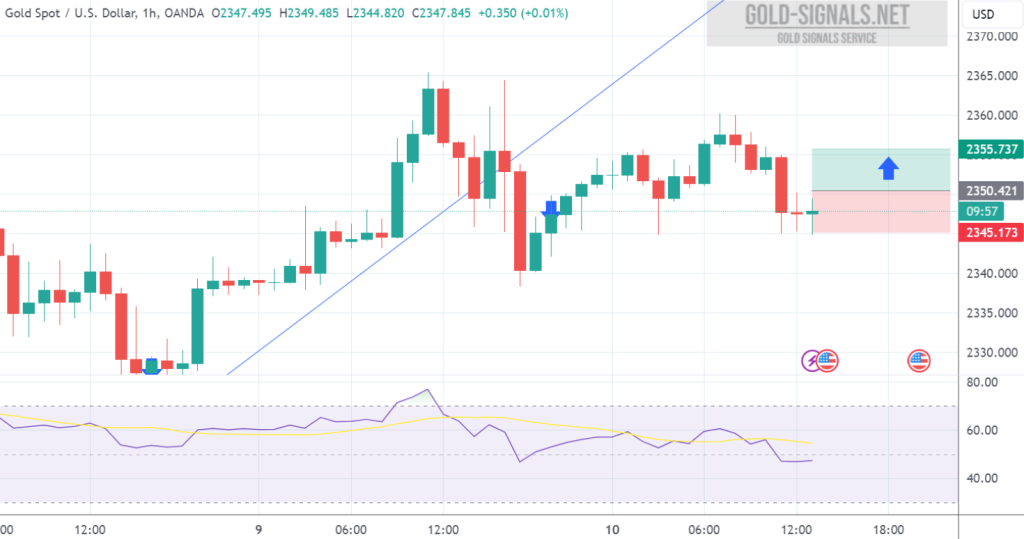
BUY at 2350.00 T/P: 2355.00 S/L: 2345.00 #XAUUSD hit T/P Price with +500 PIPs Profit
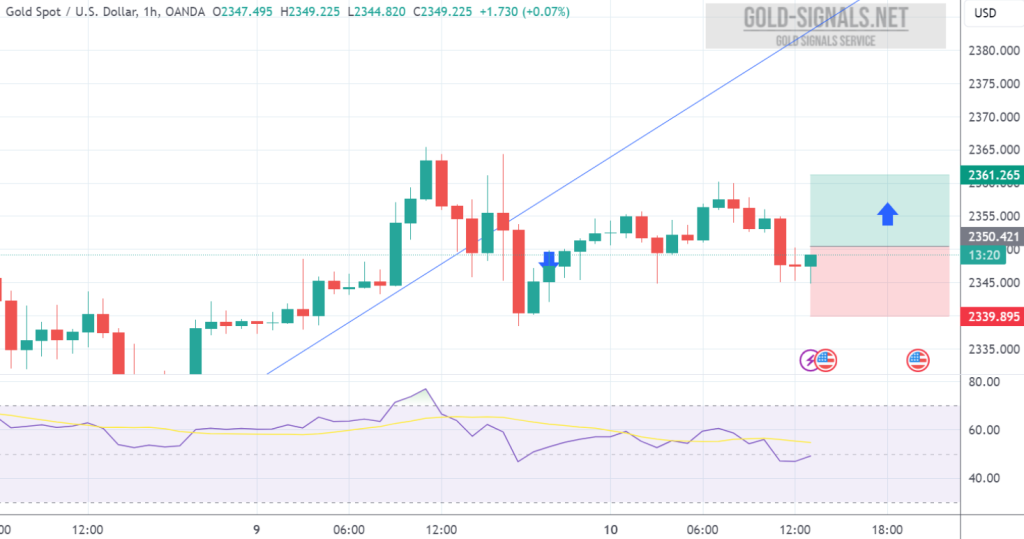
BUY at 2350.50 T/P 1: 2355.50 T/P 2: 2360.50 S/L: 2340.50 #XAUUSD hit T/P 2 Price with +1.000 PIPs Profit
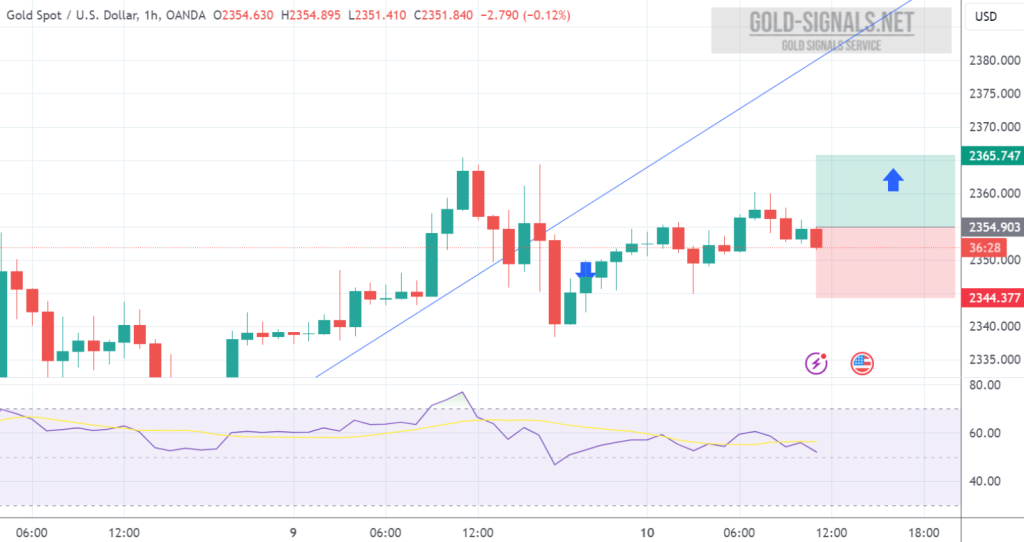
BUY at 2355.50 T/P: 2365.50 S/L: 2345.50 #XAUUSD hit S/L Price with -500 PIPs Loss
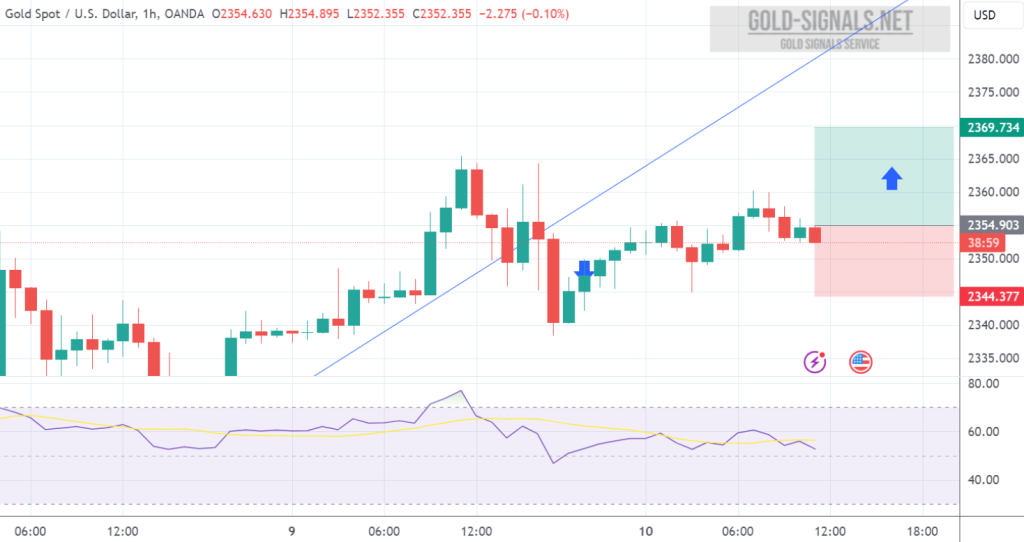
BUY at 2355.50 T/P 1: 2360.50 T/P 2: 2365.50 T/P 3: 2370.50 S/L: 2345.50 #XAUUSD hit S/L Price with -1.000 PIPs Loss