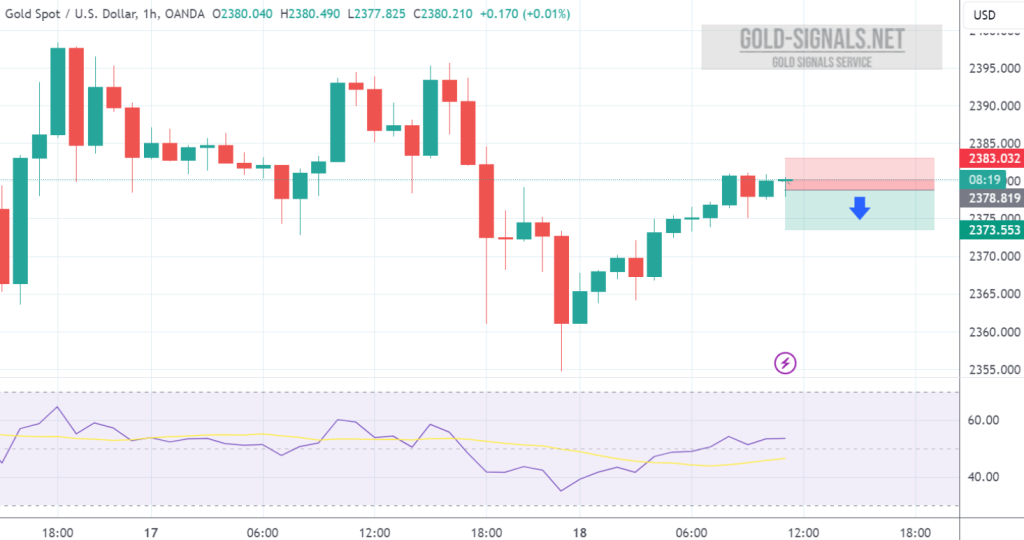
SELL at 2378.00 T/P: 2373.00 S/L: 2383.00 #XAUUSD hit T/P Price with +500 PIPs Profit
Author: GOLD Signals TEAM
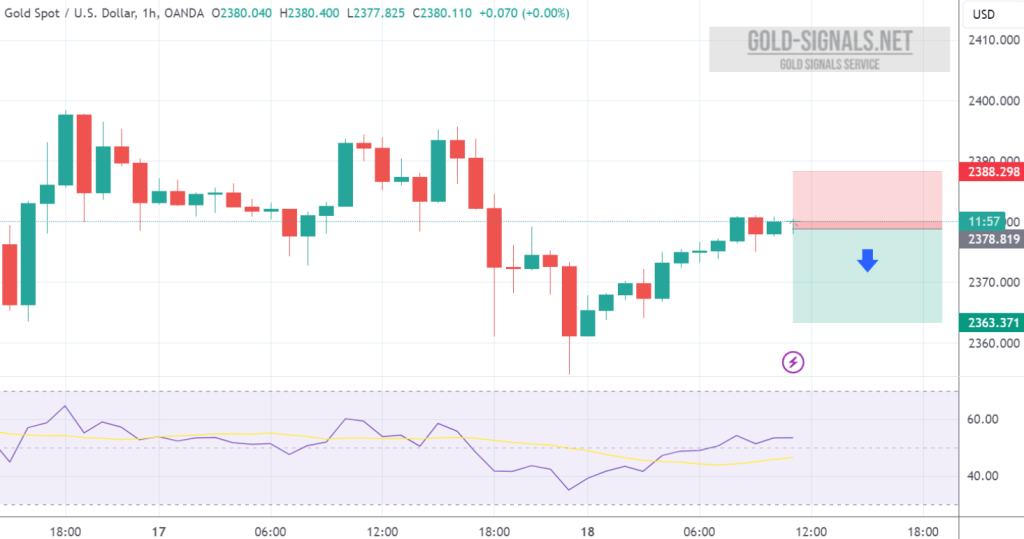
SELL at 2378.00 T/P 1: 2373.00 T/P 2: 2368.00 T/P 3: 2363.00 S/L: 2388.00 #XAUUSD hit T/P 2 Price with +1.000 PIPs Profit
Technical Analysis of XAU/USD Oscillators Summary: Buy: Momentum, Bull Bear Power Sell: MACD Level The oscillator analysis presents a mixed picture, with momentum and…
In the context of #GOLD, signaling a potential upward movement in quotes could involve testing the support line on the relative strength index (RSI) and…
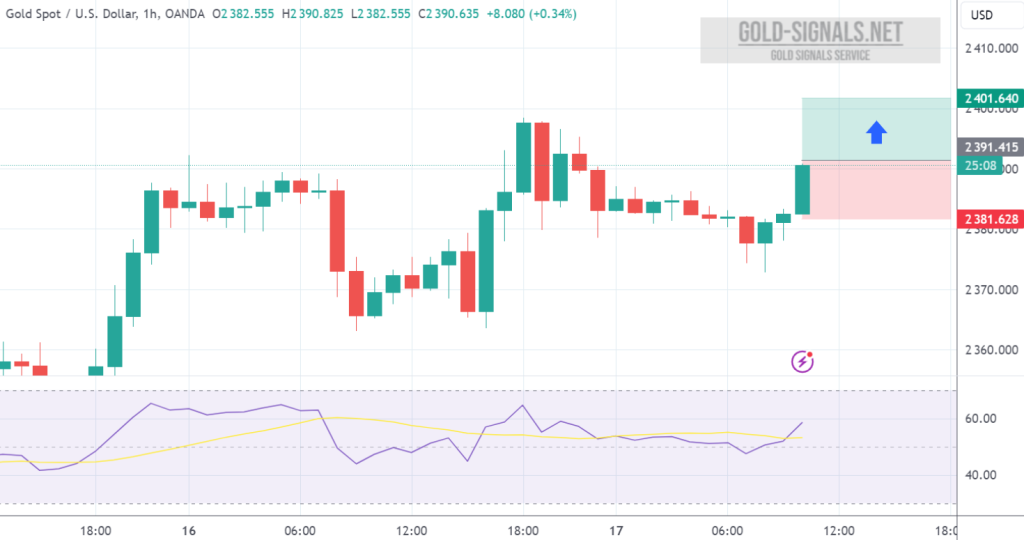
BUY at 2392.00 T/P 1: 2397.00 T/P 2: 2402.00 S/L: 2382.00 #XAUUSD hit S/L Price with -1.000 PIPs Loss
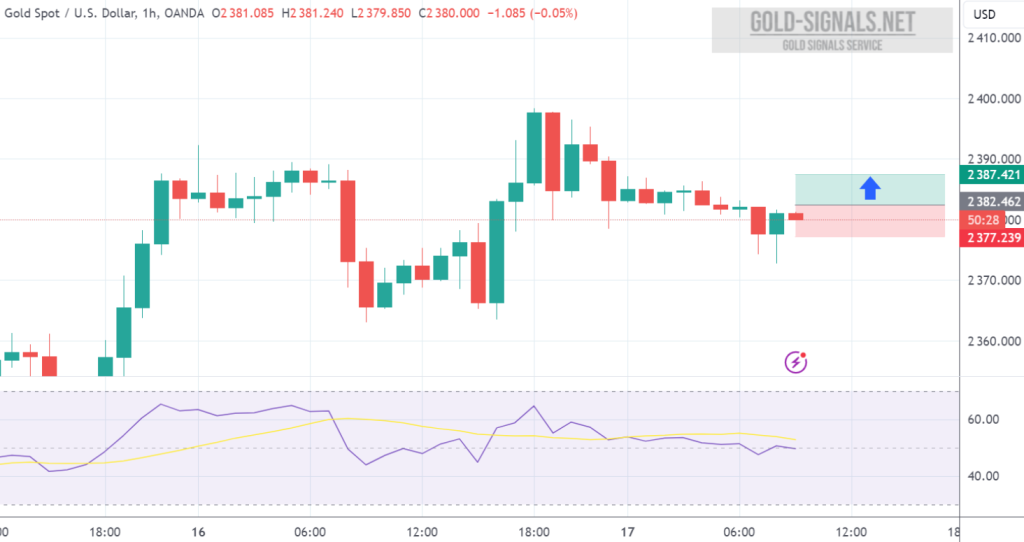
BUY at 2382.00 T/P: 2387.00 S/L: 2377.00 #XAUUSD hit T/P Price with -+500 PIPs Profit
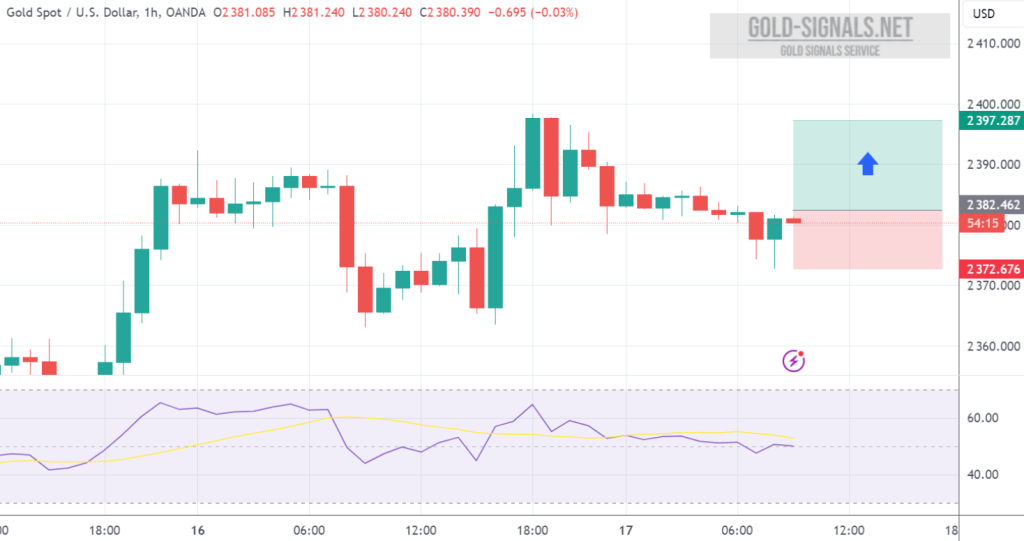
BUY at 2382.00 T/P 1: 2387.00 T/P 2: 2392.00 T/P 3: 2397.00 S/L: 2372.00 #XAUUSD hit T/P 2 Price with -+1.000 PIPs Profit
Technical Analysis of XAU/USD Oscillators Summary: Buy: Momentum Sell: MACD Level The oscillator analysis shows mixed signals, with momentum suggesting a buy sentiment while…
In the realm of #GOLD (#XAU/USD), a potential catalyst for an upward movement in quotes could emerge from testing the support line on the relative…
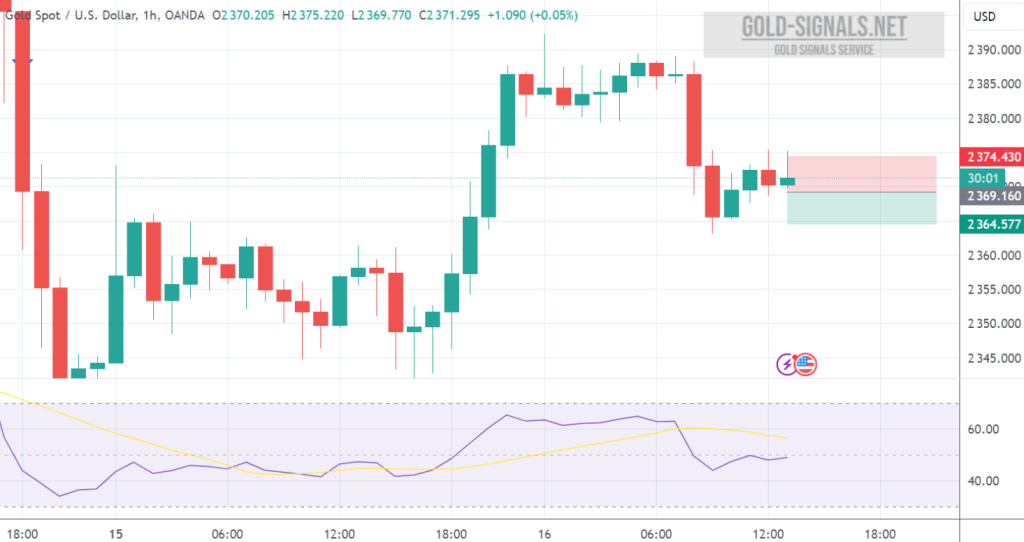
SELL at 2369.00 T/P. 2364.00 S/L: 2379.00 #XAUUSD hit T/P 1 Price with -+500 PIPs Profit