
SELL at 2315.00 T/P: 2310.00 S/L: 2320.00
Author: GOLD Signals TEAM
Technical Analysis for XAU/USD (Gold Market) – 1H Chart Oscillators Summary: Buy: None Neutral: Relative Strength Index (14), Stochastic %K (14, 3, 3), Commodity…
An additional indication suggesting a decline in XAU/USD rates would be a challenge to the resistance line on the relative strength index (RSI). Following that,…
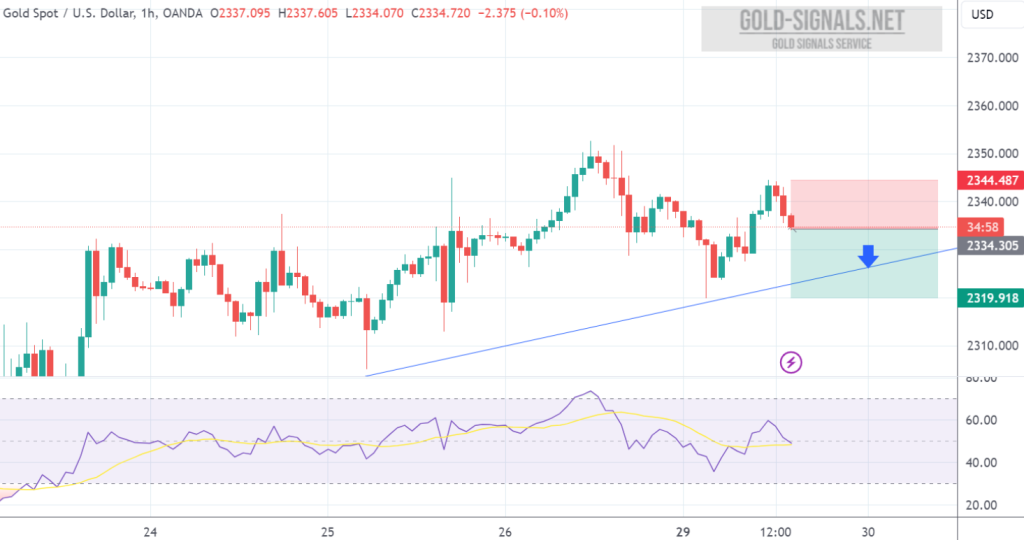
SELL at 2333.00 T/P 1: 2328.00 T/P 2: 2323.00 T/P 3: 2318.00 S/L: 2343.00

Technical analysis of XAU/USD on the 1H chart indicates a bearish trend, supported by sell signals from oscillators and moving averages. However, pivot points suggest…
Technical Analysis for XAU/USD (Gold Market) – 1H Chart Oscillators Summary: Buy: None Neutral: Relative Strength Index (14), Stochastic %K (14, 3, 3), Commodity…

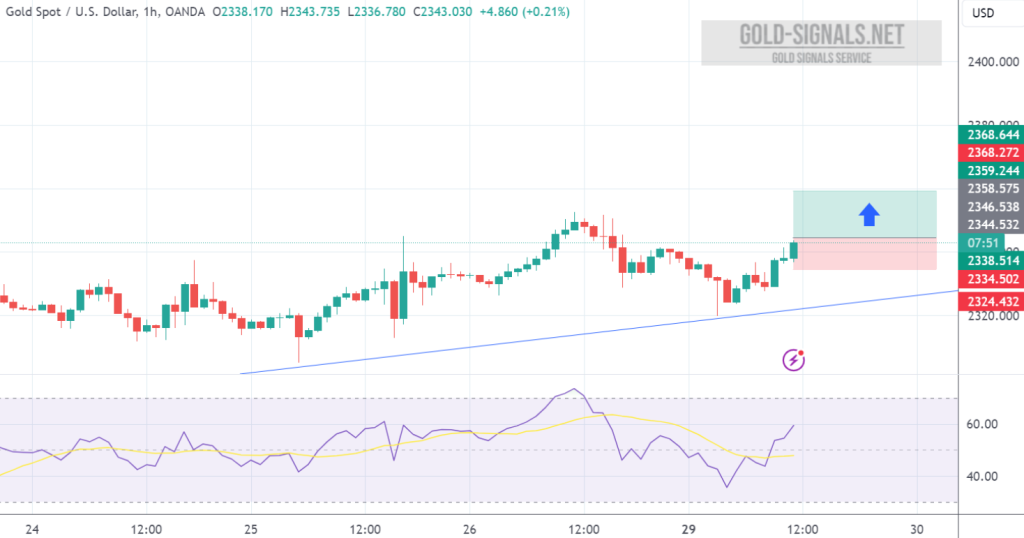
Technical Analysis for XAU/USD (Gold Market) – 1H Chart Oscillators Summary: Buy: Momentum (10), MACD Level (12, 26) Neutral: Relative Strength Index (14), Stochastic…