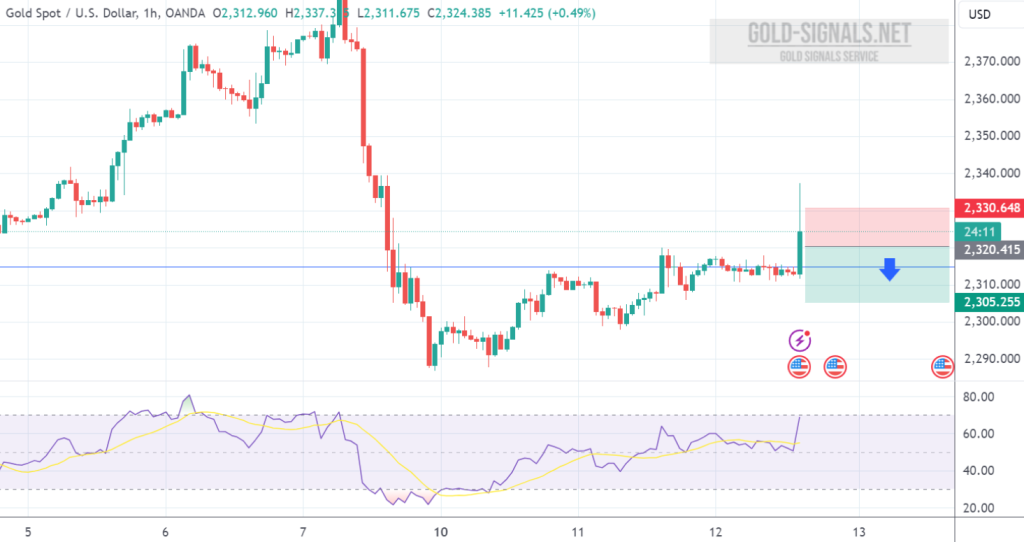
SELL at 2320.00 T/P 1: 2315.00 T/P 2: 2310.00 T/P 3: 2305.00 S/L: 2330.00 #XAUUSD hit T/P 3 Price with +1.500 PIPs Profit
Author: GOLD Signals TEAM
Current Price: XAU/USD is trading at 2313.03 as of 09:30 AM. Oscillators Summary Buy: Momentum Sell: MACD Level Neutral: Relative Strength Index (RSI), Stochastic…
A potential decrease in XAU/USD quotes could be signaled by a test of the resistance line on the relative strength index (RSI). Another indicator would…
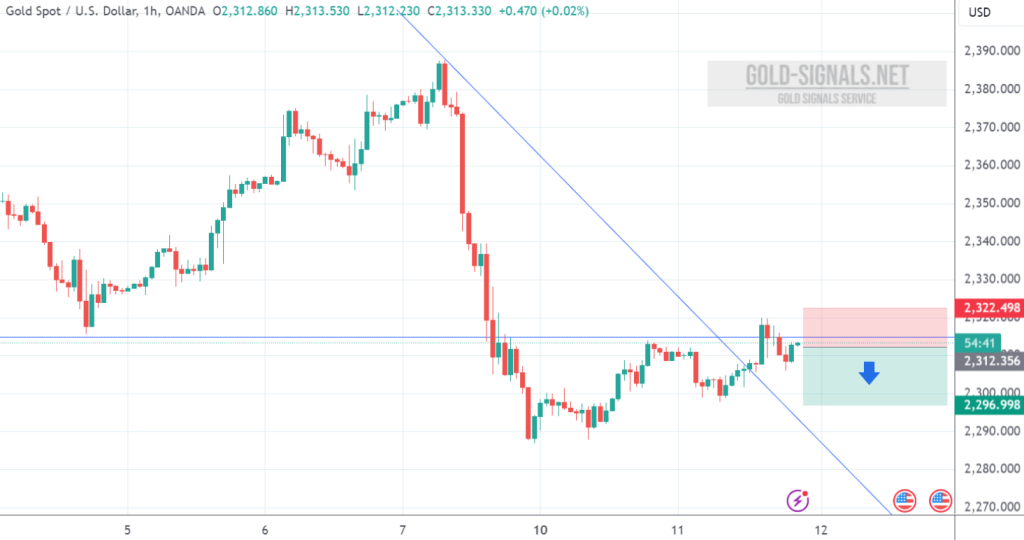
SELL at 2312.00 T/P 1: 2307.00 T/P 2: 2302.00 T/P 3: 2297.00 S/L: 2322.00 #XAUUSD hit S/L Price with -1.000 PIPs Loss
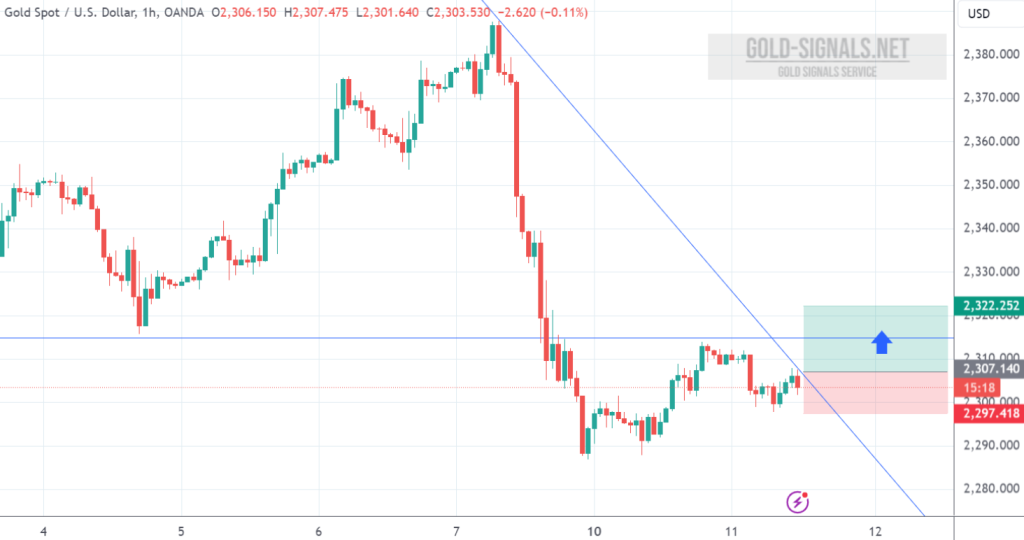
BUY at 2307.50 T/P 1: 2312.50 T/P 2: 2317.50 T/P 3: 2322.50 S/L: 2297.50 #XAUUSD hit T/P 3 Price with +1.500 PIPs Profit
Current Price: XAU/USD is trading at 2302.42 as of 10:30 AM. Oscillators Summary Buy: MACD Level Sell: Momentum Neutral: Relative Strength Index (RSI), Stochastic %K,…
To suggest a potential decrease in XAU/USD quotes, watch for a test of the resistance line on the relative strength index (RSI) and a breakout…
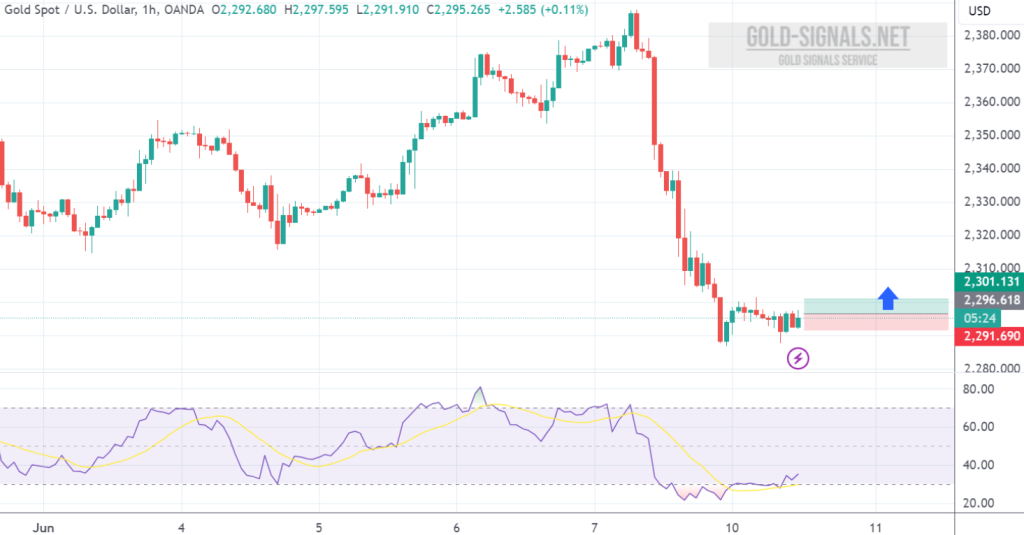
BUY at 2296.50 T/P: 2301.50 S/L: 2291.50 #XAUUSD hit T/P Price with +500 PIPs Profit
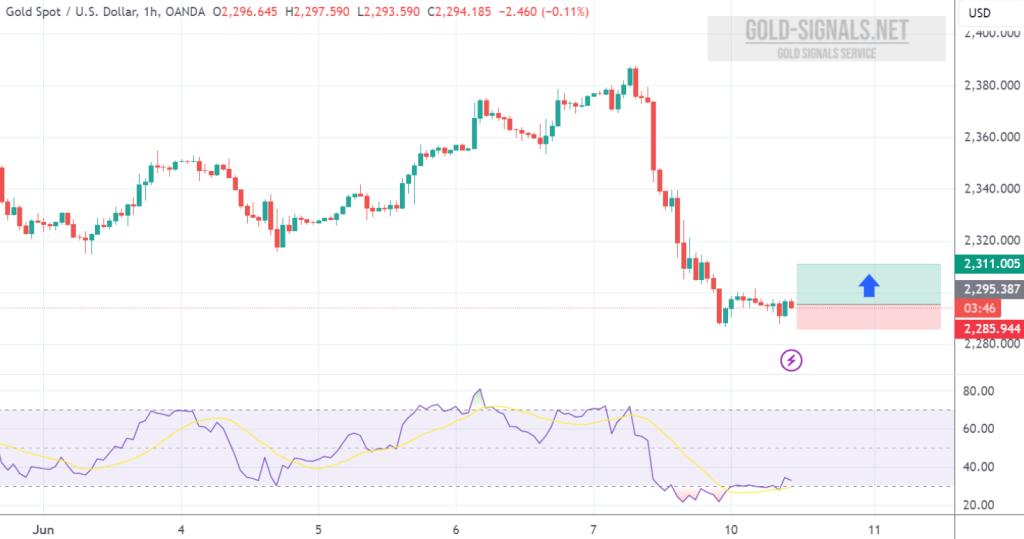
BUY at 2295.00 T/P 1: 2300.00 T/P 2: 2305.00 T/P 3: 2310.00 S/L: 2285.00 #XAUUSD hit T/P 3 Price with +1.500 PIPs Profit
Current Price: XAU/USD is trading at 2295.43 as of 08:38 AM. Oscillators Summary Buy: Momentum, MACD Level Sell: Bull Bear Power Neutral: Relative Strength…