In the trading week of June 17-21, 2024, a potential increase in gold prices could be indicated by a rebound from the support line on…
Author: GOLD Signals TEAM
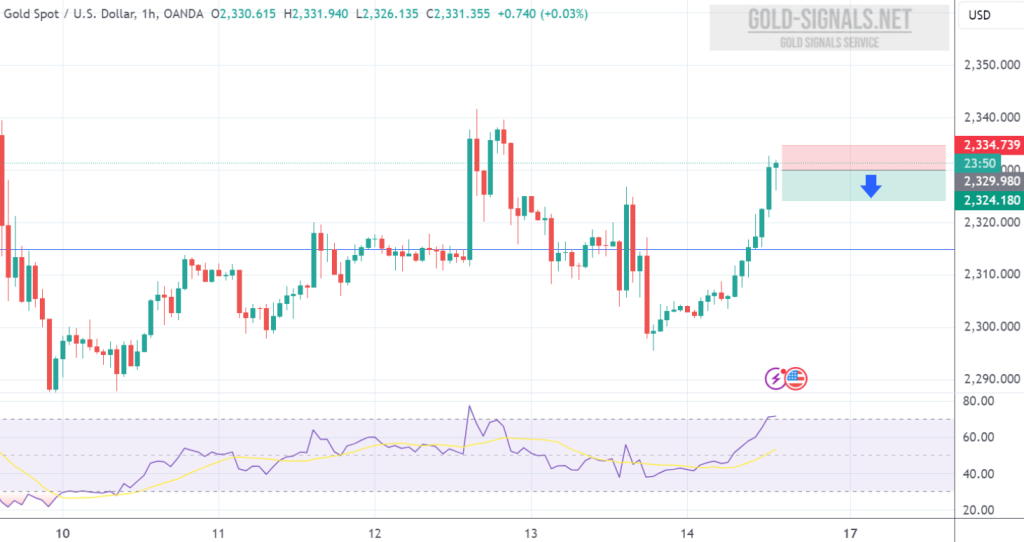
SELL at 2330.00 T/P: 2325.00 S/L: 2335.00 #XAUUSD hit T/P Price with +500 PIPs Profit
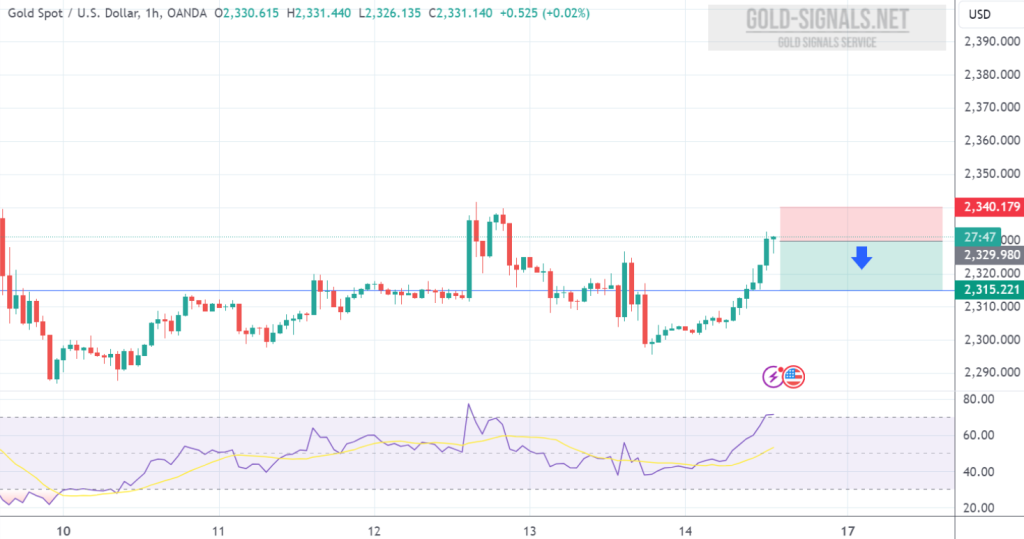
SELL at 2329.00 T/P 1: 2324.00 T/P 2: 2319.00 T/P 3: 2314.00 S/L: 2339.00 #XAUUSD hit T/P 3 Price with +1.500 PIPs Profit
Current Price: XAU/USD is trading at 2324.86 as of 11:17 AM. Oscillators Summary Buy: MACD Level, Ultimate Oscillator Sell: Momentum Neutral: Relative Strength Index…
A potential decrease in XAU/USD quotes could be indicated by a test of the resistance line on the relative strength index (RSI) and a breakout…
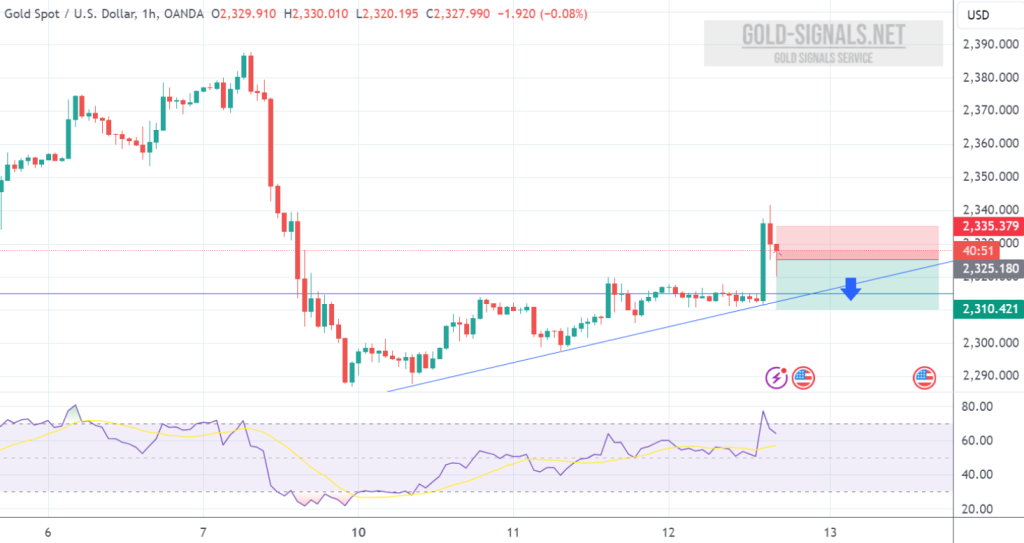
SELL at 2317.00 T/P 1: 2312.00 T/P 2: 2307.00 T/P 3: 2302.00 S/L: 2327.00 #XAUUSD hit T/P 3 Price with +1.500 PIPs Profit
Current Price: XAU/USD is trading at 2319.70 as of 11:42 AM. Oscillators Summary Buy: Momentum, MACD Level Sell: None Neutral: Relative Strength Index (RSI),…
A potential decline in XAU/USD quotes could be indicated by a test of the resistance line on the relative strength index (RSI) and a breakout…

SELL at 2325.00 T/P 1: 2320.00 T/P 2: 2315.00 T/P 3: 2310.00 S/L: 2335.00 #XAUUSD hit S/L Price with -1.000 PIPs Loss
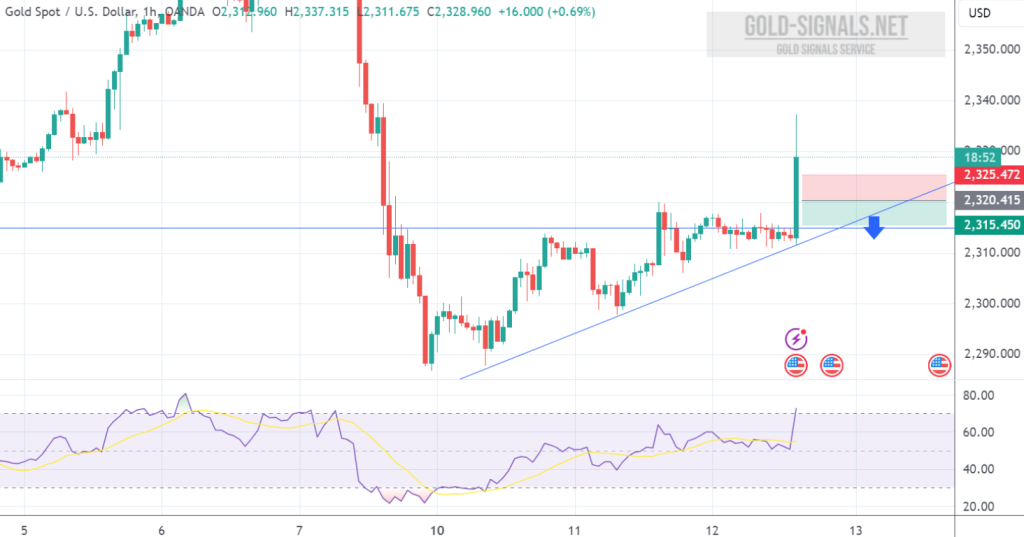
SELL at 2320.00 T/P: 2315.00 S/L: 2325.00 #XAUUSD hit T/P Price with +500 PIPs Profit