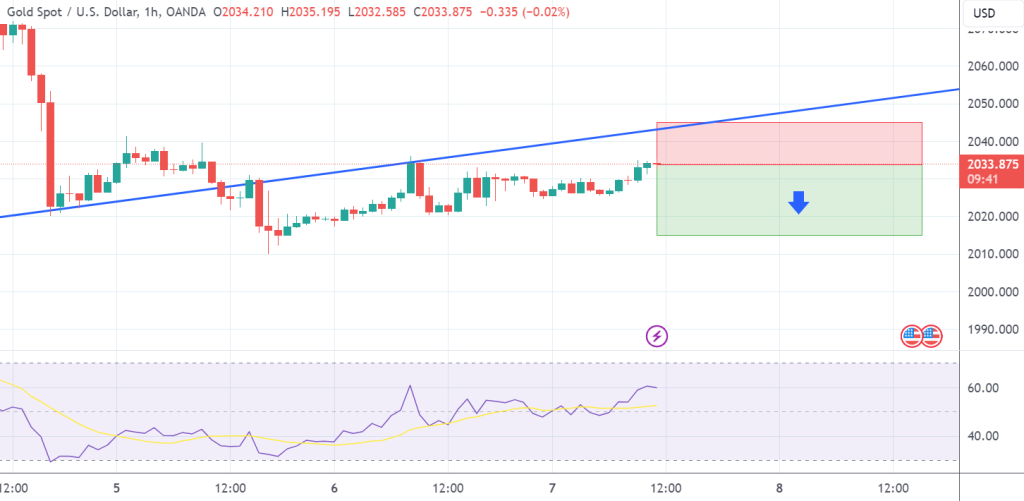
The price of gold continues its horizontal movement. The market exhibits a bouncing behavior within the defined range limits. I anticipate the market will engage…
Author: GOLD Signals TEAM
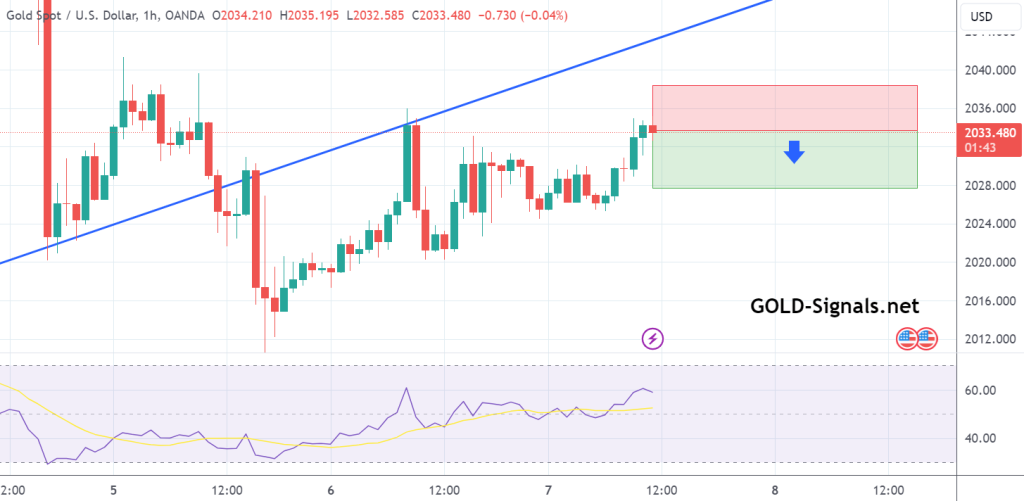
SELL at 2032.00 T/P: 2027.00 S/L: 2037.00 #XAUUSD hit T/P Price with +500 PIPs Profit
SELL at 2032.00 T/P 1: 2027.00 T/P 2: 2022.00 T/P 3: 2017.00 T/P 4: 2012.00 S/L: 2047.00 #XAUUSD hit T/P 4 Price with +2.000 PIPs…
The gold market is nearing the prior daily peaks. Following a false breakout, it established a range zone. The price executed an impulse move originating…
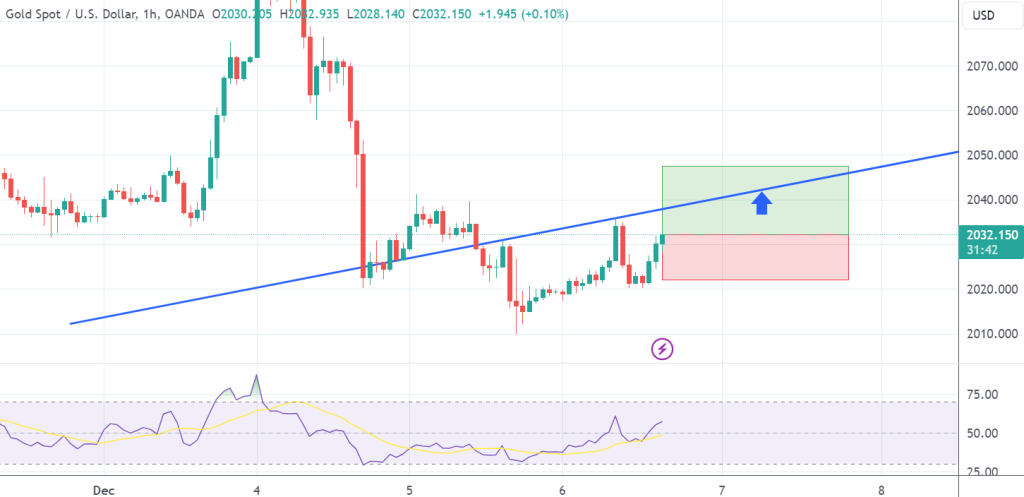
BUY at 2032.50 T/P 1: 2037.50 T/P 2: 2042.50 T/P 3: 2047.50 S/L: 2022.50 #XAUUSD hit T/P 1 Price with +500 PIPs Profit
Gold executed a substantial false breakout from the resistance zone. My perspective is that the market is poised for a period of consolidation following the…
Technical Analysis for XAU/USD (Gold/US Dollar) – 1-Hour Chart At the time of analysis, XAU/USD is trading at 2019.27. OSCILLATORS: Buy: Momentum (10), MACD…
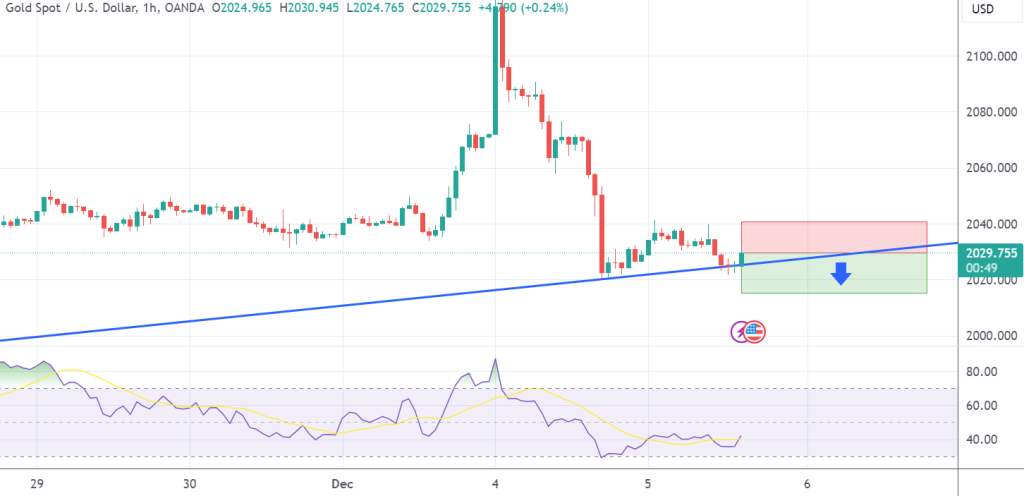
SELL at 2029.00 T/P 1: 2024.00 T/P 2: 2019.00 T/P 3: 2014.00 S/L: 2039.00 #XAUUSD hit T/P 3 Price with +1.500 PIPs Profit
The recent market dynamics align closely with my previous analysis. The resistance faced rejection, evident in the formation of a substantial bearish rejection bar, followed…

SELL at 2032.00 T/P: 2027.00 S/L: 2037.00 #XAUUSD hit T/P Price with +500 PIPs Profit