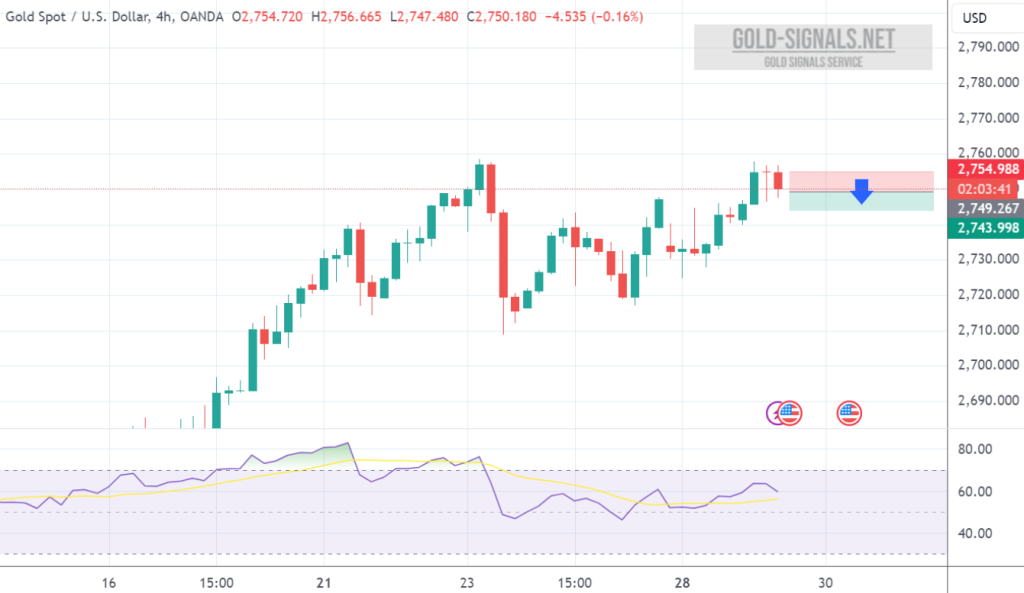
Current Price: XAUUSD 2739.50 Timeframe: This analysis combines 1-hour and 4-hour timeframes to provide a comprehensive view of the XAUUSD market. Overall Bias: Neutral with…
Author: GOLD Signals TEAM
A bullish signal for Gold prices this week (November 4–8) is anticipated due to a potential rebound from the support line on the Relative Strength…
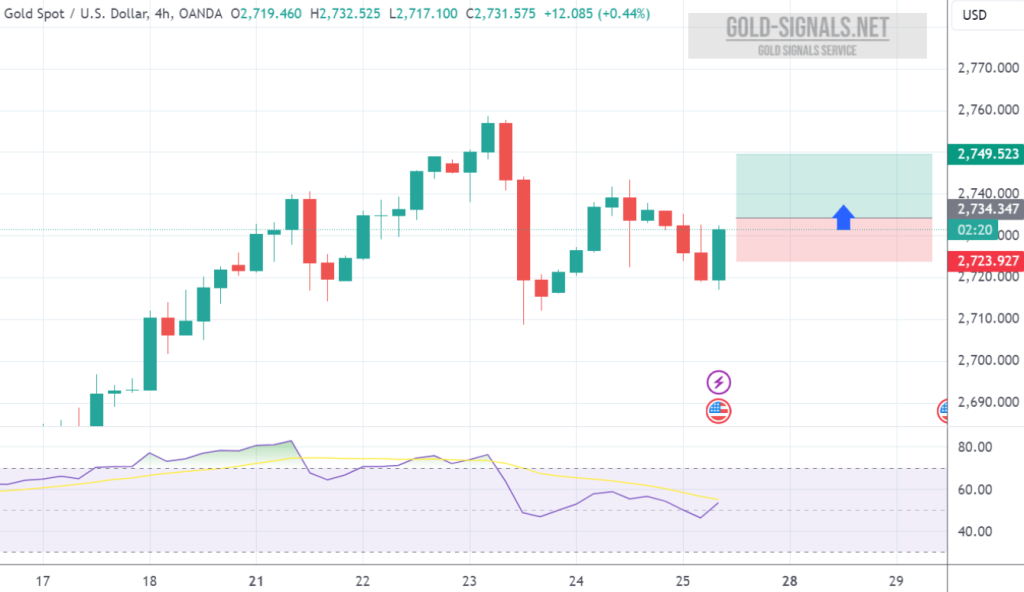
Current Price: XAUUSD 2749.06 Timeframe Analysis: 1 Hour: Neutral bias. Momentum indicators are mixed, with some suggesting sell signals (MACD, Momentum) while others are neutral…
A potential boost for XAUUSD may come from a rebound on the Relative Strength Index (RSI) support line and a bounce from the lower boundary…
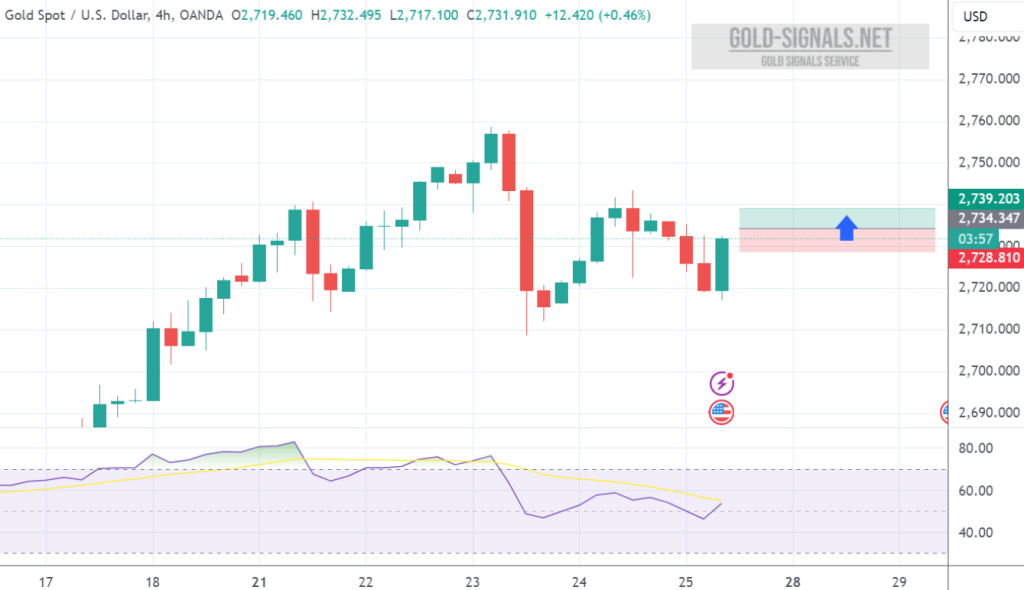
Current Price: 2732.39 Date & Time: 2024-10-28 08:38:43 Oscillators (1H & 4H Analysis) 1H Oscillators: Mostly neutral with a slight Sell bias indicated by the…
A likely signal for a BUY in XAUUSD from Oct 28 – Nov 1, 2024, is an anticipated rebound from both the relative strength indicator…