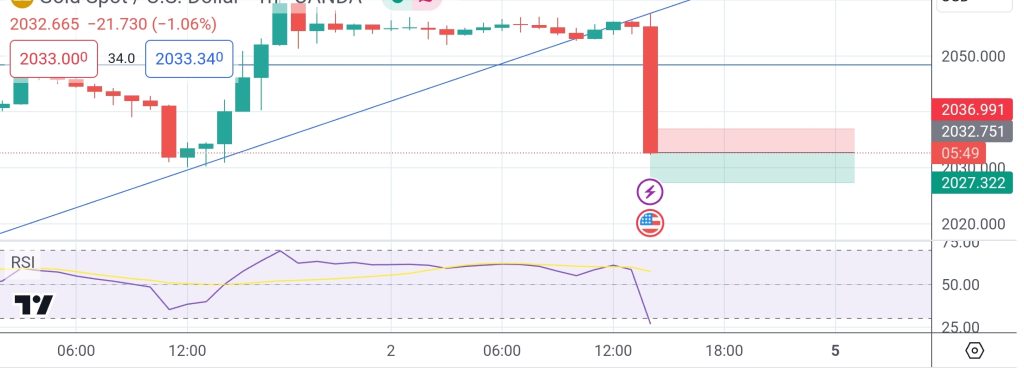
SELL at 2032.00 T/P: 2027.00 S/L: 2037.00 #XAUUSD hit T/P Price with +500 PIPs
Author: GOLD Signals TEAM
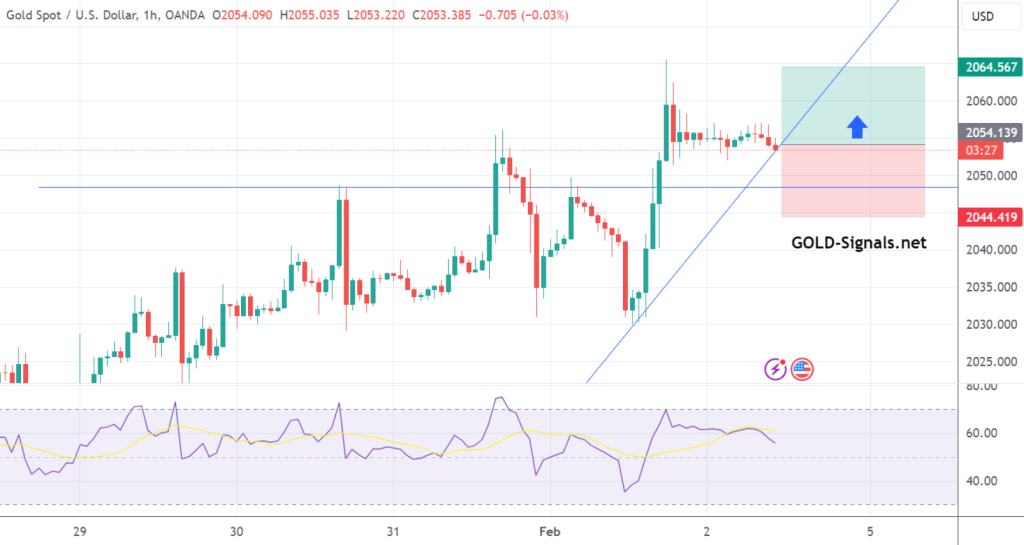
BUY at 2054.50 T/P: 2059.50 T/P: 2064.50 S/L: 2044.50 #XAUUSD hit S/L Price with -1.000 PIPs Loss
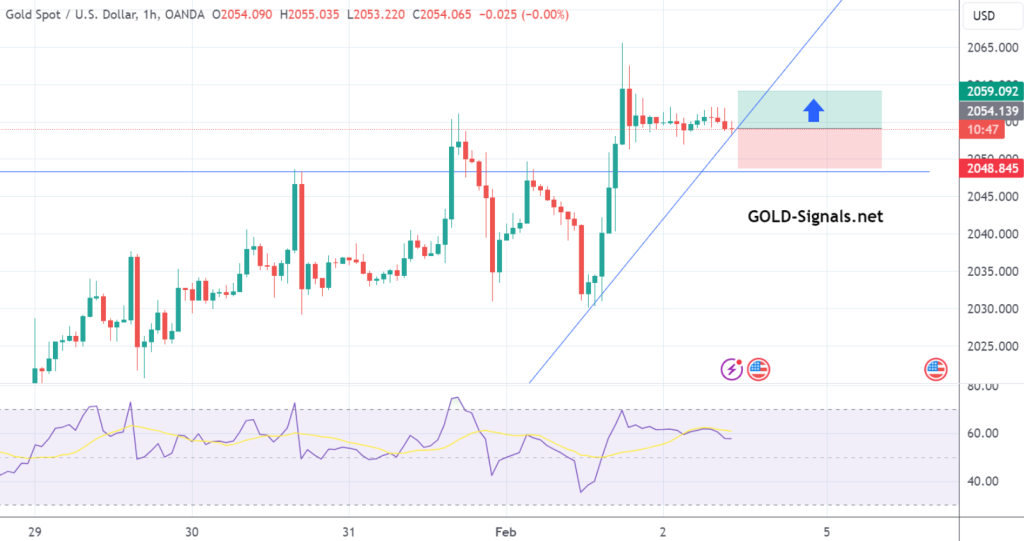
BUY at 2055.50 T/P: 2060.50 S/L: 2050.50 #XAUUSD hit S/L Price with -500 PIPs Loss
XAU/USD Technical Analysis – Market Overview Current XAU/USD Price: $2054.28 (as of 10:39 PM) Oscillators Summary Neutral Signals: Relative Strength Index (RSI 14): 38.093…
For potential growth in #GOLD, watch for a test of the RSI support line and a rebound from the upper border of the bearish channel.…
Total Profit in January: +22.000 PIPs GOLD Signal – 2.1.2024 | T/P 3: +1.500 PIPs GOLD Signal – 3.1.2024 | T/P 4: +2.000 PIPs GOLD…

The GOLD Market currently shows mixed signals. Oscillators, such as RSI and CCI, indicate a neutral stance, but the Williams Percent Range suggests a buying…
The XAU/USD (Gold) 1-hour chart analysis provides a comprehensive view for potential trading strategies. As of the latest data at 01:07 PM, let’s break down…
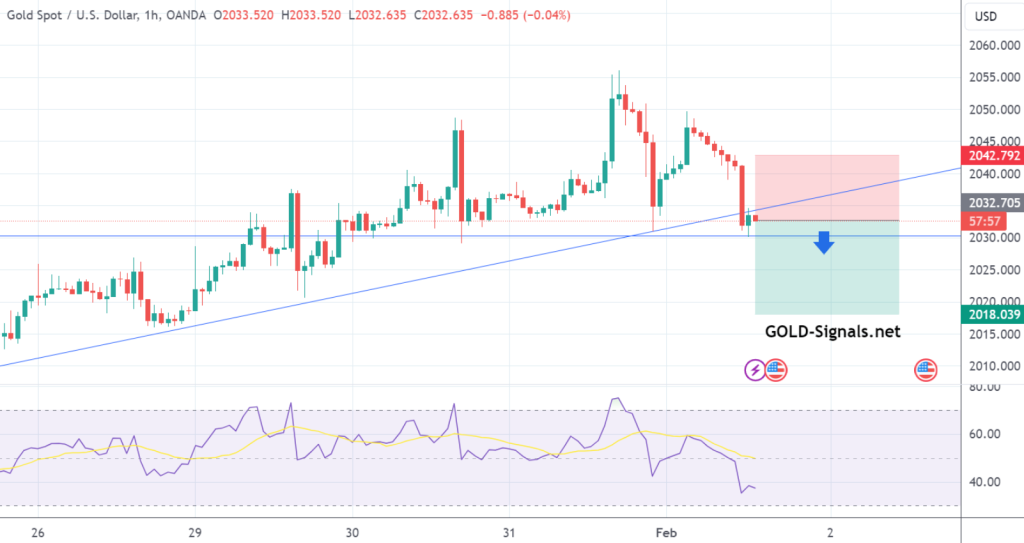
SELL at 2032.00 T/P 1: 2027.00 T/P 2: 2022.00 T/P 3: 2017.00 S/L: 2042.00 #XAUUSD hit S/L Price with -1.000 PIPs Loss