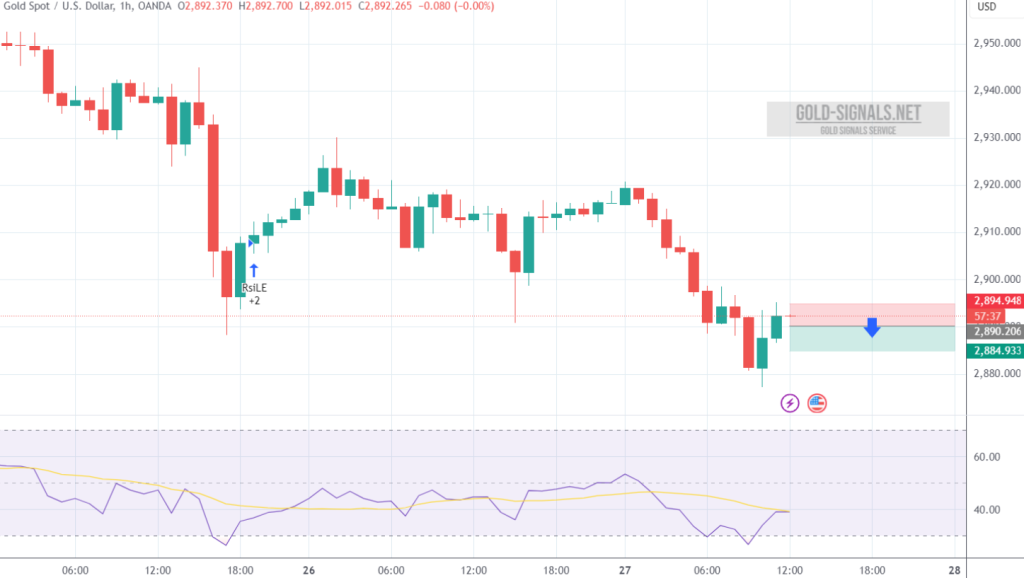
SELL at 2890.50 T/P: 2885.50 S/L: 2895.50 #XAUUSD hit T/P with +500 PIPs Profit
Author: GOLD Signals TEAM
Current Price: 2890.72 Time: 2025-02-27 10:32:18 Technical Analysis: Oscillators (1H): Mixed signals, with most indicators neutral. Momentum suggests a potential Buy, while MACD indicates a…

The gold price (XAU/USD) fell to a two-week low of around $2,880 in the first half of the European trading session. A slight increase in…
A bearish signal for XAUUSD is confirmed by a test of the downward trendline on the RSI and a rebound from the lower boundary of…
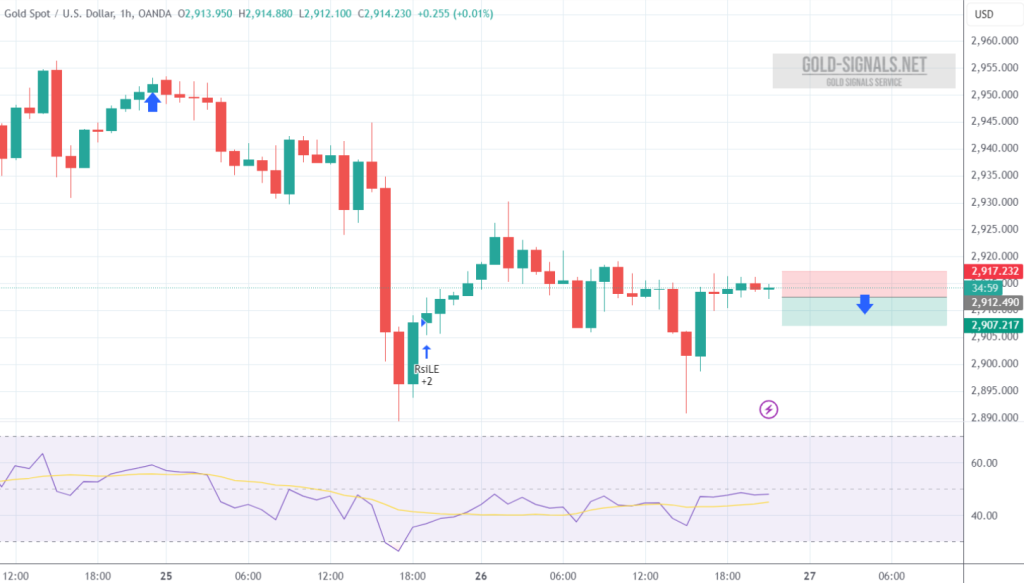
SELL at 2912.50 T/P: 2907.50 S/L: 2917.50 #XAUUSD hit S/L with -500 PIPs Loss
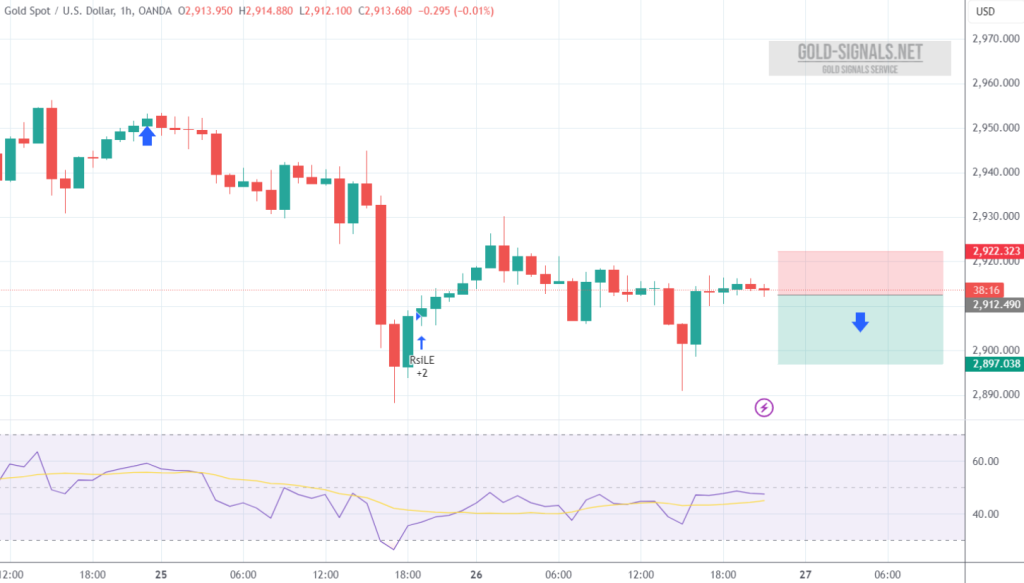
SELL at 2912.00 T/P 1: 2907.00 T/P 2: 2902.00 T/P 3: 2897.00 S/L: 2922.00 #XAUUSD hit T/P 3 with +1.500 PIPs Profit
Current Price: 2915.80 Time: 2025-02-26 19:43:14 Technical Analysis: Oscillators: 1H: Mixed signals, primarily neutral. Momentum and MACD Level indicate potential buy, while Bull Bear Power…

Gold prices slightly declined on Wednesday following a recent record surge, as investors eagerly anticipate upcoming inflation data and the latest developments regarding US President…
A bullish signal for XAU/USD is indicated by a test of the upward trendline on the RSI indicator. Additionally, a rebound from the lower boundary…

Gold prices retreated from record levels on Tuesday afternoon as investors seized the opportunity to take profits, while safe-haven demand continued to strongly support the…