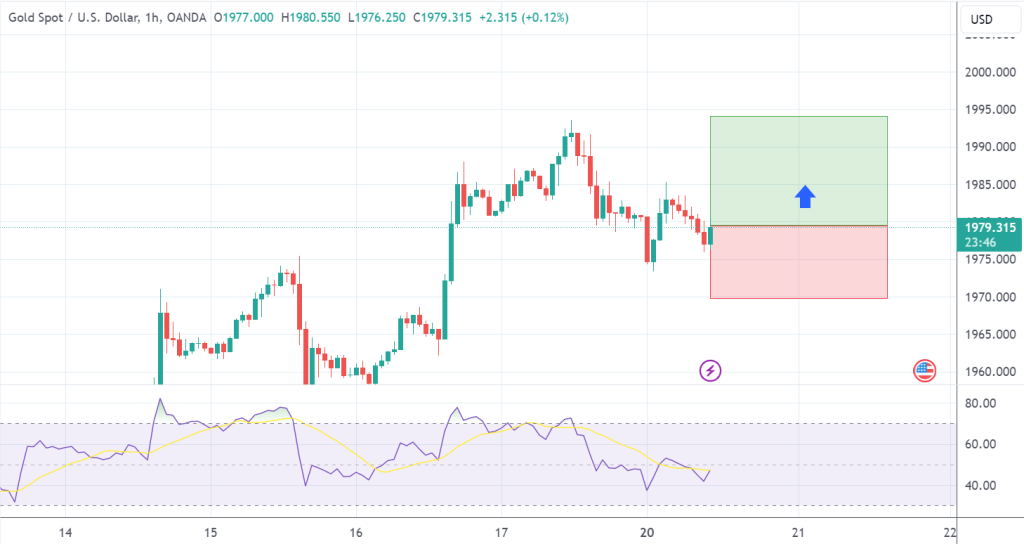
BUY at 1979.50 T/P 1: 1984.50 T/P 2: 1989.50 T/P 3: 1994.50 S/L: 1965.50 #XAUUSD hit T/P 3 Price with +1.500 PIPs Profit
Author: GOLD Signals TEAM
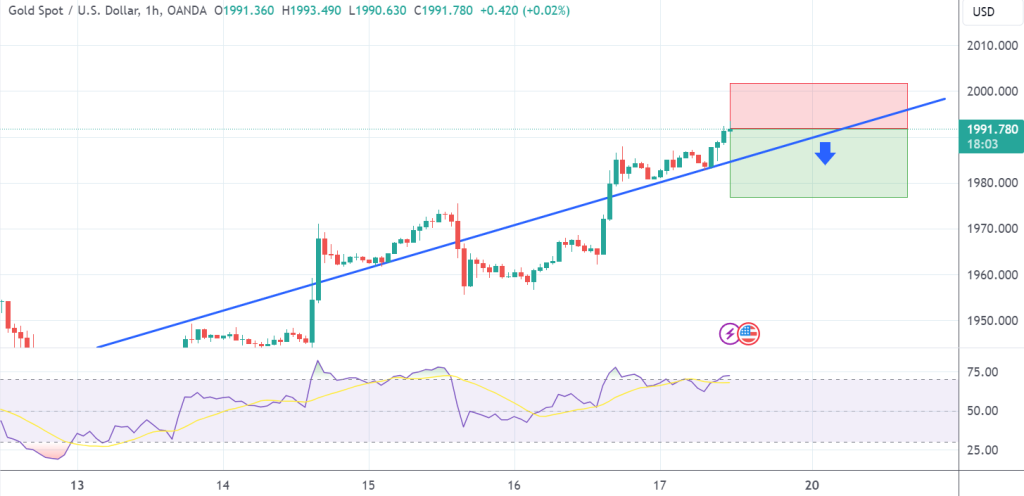
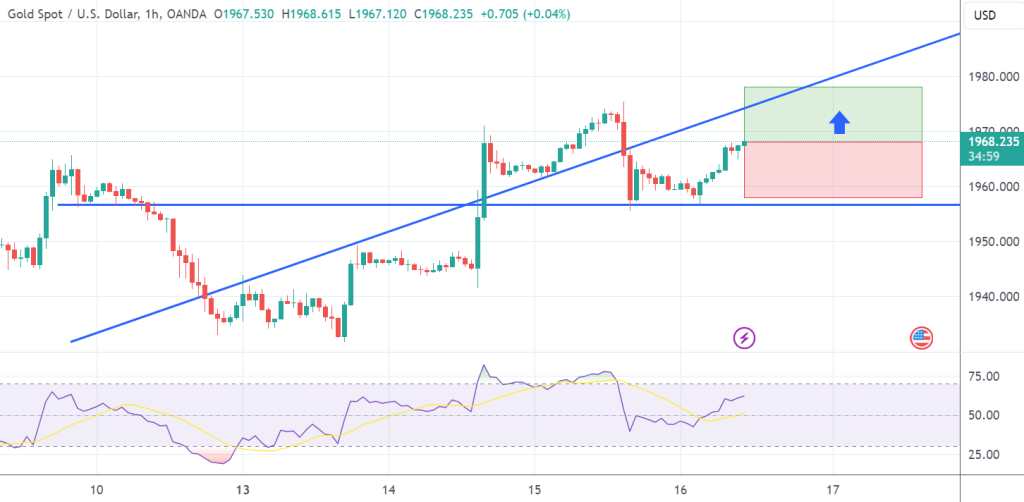
The market is approaching the main resistance at 2000. Gold may pull back from the resistance zone and channel border because it has bounced off…
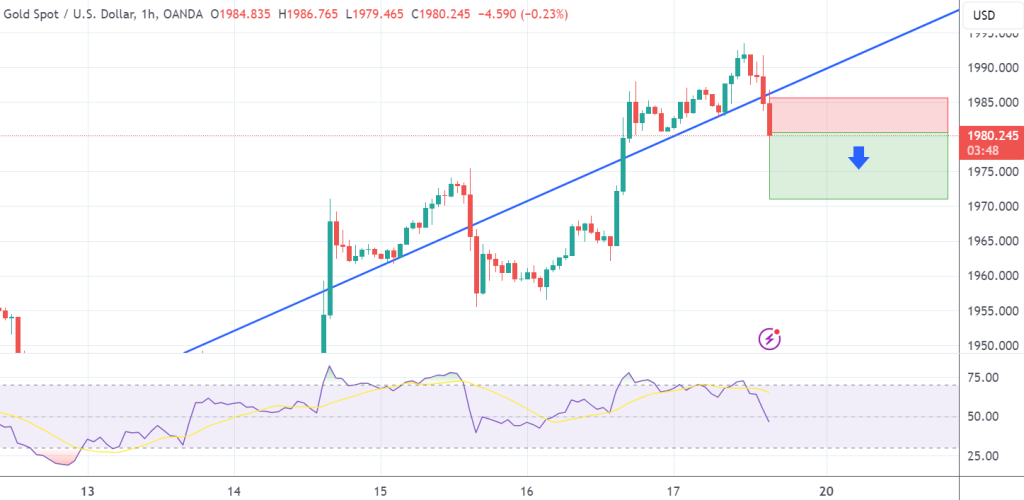
SELL at 1979.00 T/P 1: 1974.00 T/P 2: 1969.00 S/L: 1989.00 #XAUUSD hit T/P 2 Price with +1.000 PIPs Profit
SELL at 1990.00 T/P: 1985.00 S/L: 1995.00 #XAUUSD hit T/P Price with +500 PIPs Profit
This benchmark shows a real-time overview of the technical analysis for the selected timeframe. Summary Gold Spot/USD is based on the most popular technical indicators…
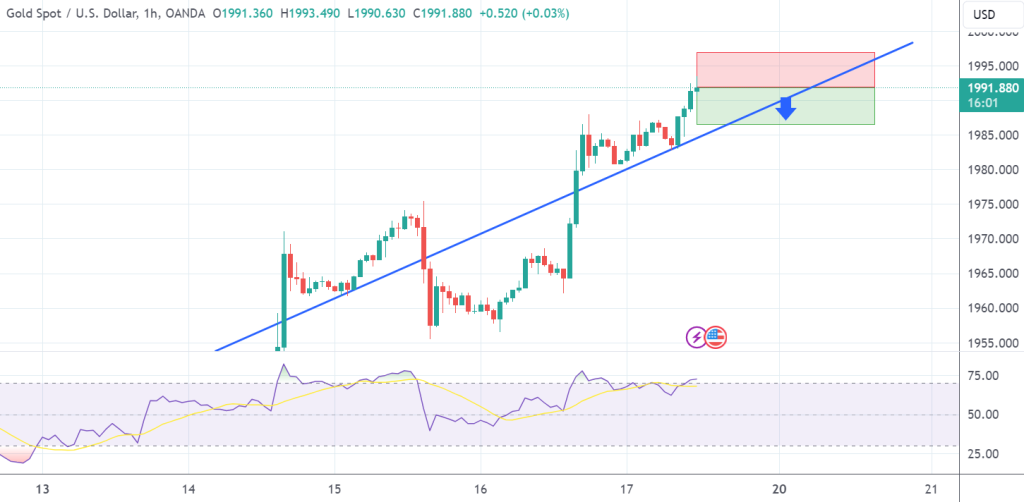
SELL at 1991.00 T/P 1: 1986.00 T/P 2: 1981.00 T/P 3: 1976.00 S/L: 2001.00 #XAUUSD hit T/P 2 Price with +1.000 PIPs Profit
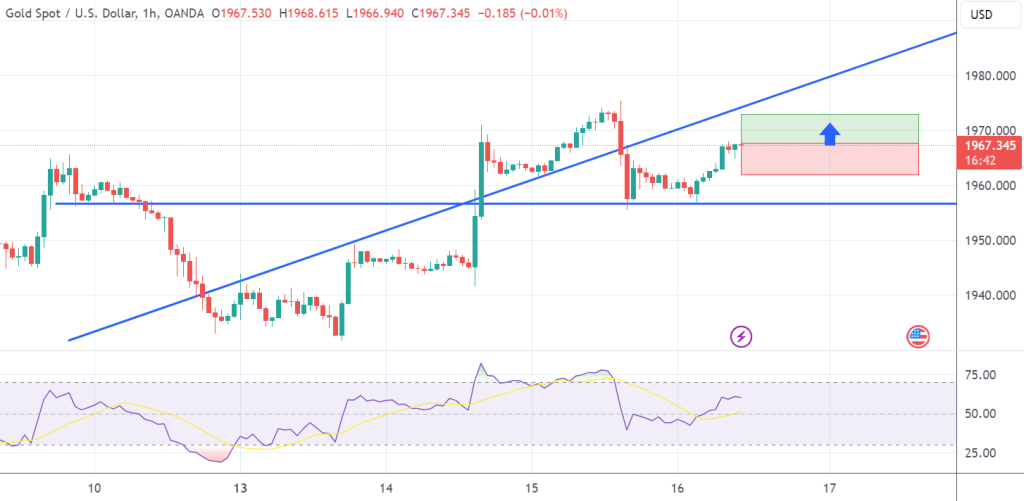
The recent price movement aligns seamlessly with my previous analysis. The market is progressing towards the primary resistance zone at 2000. The price established a…
BUY at 1968.00 T/P: 1973.00 S/L: 1963.00 #XAUUSD hit T/P Price with +500 PIPs Profit
BUY at 1969.00 T/P 1: 1974.00 T/P 2: 1979.00 T/P 3: 1984.00 S/L: 1959.00 #XAUUSD hit T/P 3 Price with +1.500 PIPs Profit
This benchmark shows a real-time overview of the technical analysis for the selected timeframe. Summary Gold Spot/USD is based on the most popular technical indicators…