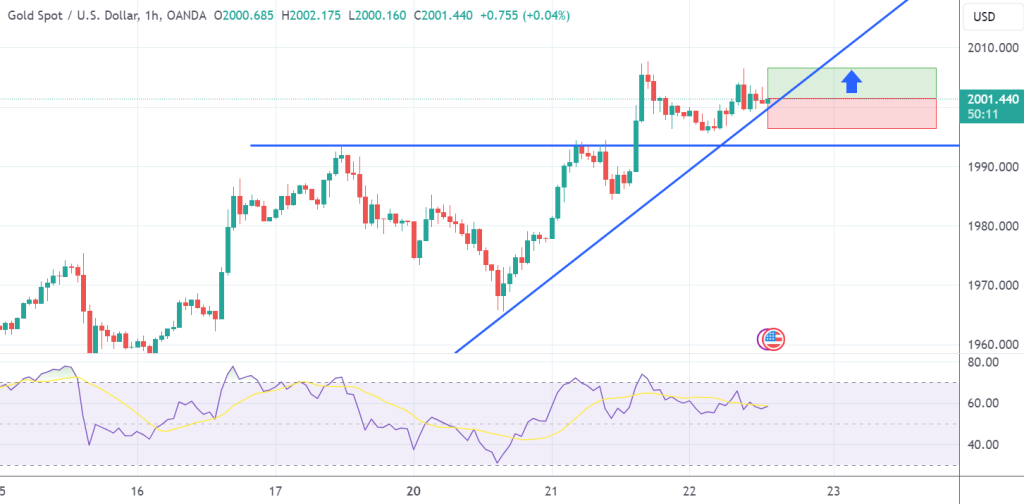
BUY at 2002.50 T/P: 2007.50 S/L: 1997.50 #XAUUSD hit S/L Price with -500 PIPs Loss
Author: GOLD Signals TEAM
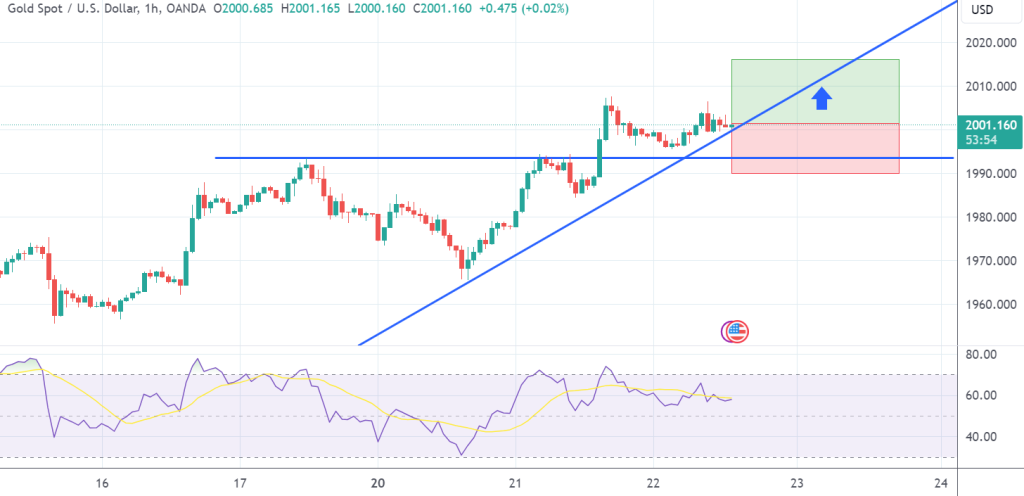
BUY at 2002.00 T/P 1: 2007.00 T/P 2: 2012.00 T/P 3: 2017.00 S/L: 1992.00 #XAUUSD hit T/P 3 Price with +1.500 PIPs Profit
Technical Analysis for XAU/USD (Gold/US Dollar) – 1-Hour Chart At the time of analysis, XAU/USD is trading at 2000.82 OSCILLATORS: Buy: Exponential Moving Average…
The price successfully penetrated the 2000 resistance zone following the release of recent news. A rejection candle formed in the market, indicating potential pullbacks. My…
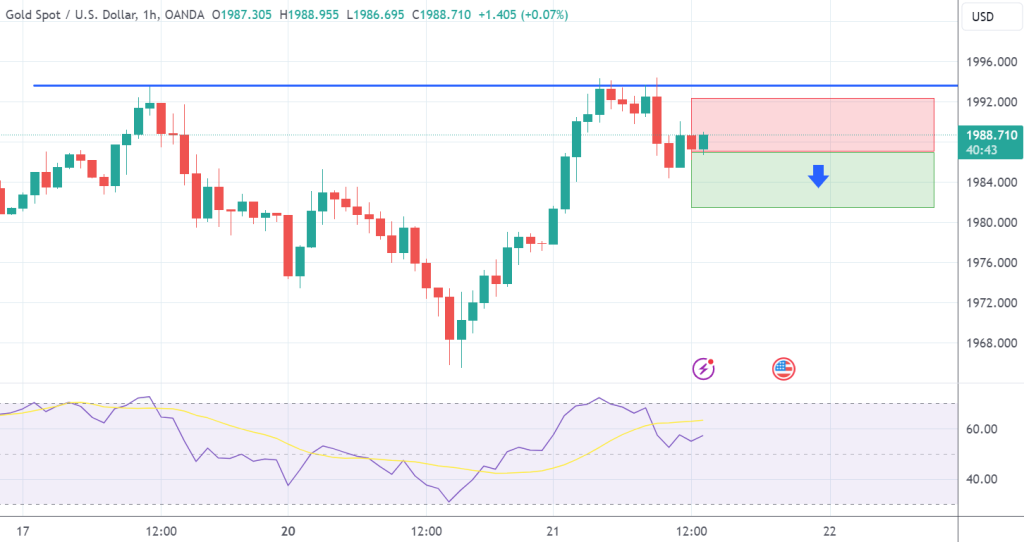
SELL at 1987.00 T/P: 1982.00 S/L: 1992.00 #XAUUSD hit S/L Price with -500 PIPs Loss
SELL at 1987.00 T/P 1: 1982.00 T/P 2: 1977.00 T/P 3: 1972.00 S/L: 1997.00 #XAUUSD hit S/L Price with -1.000 PIPs Loss
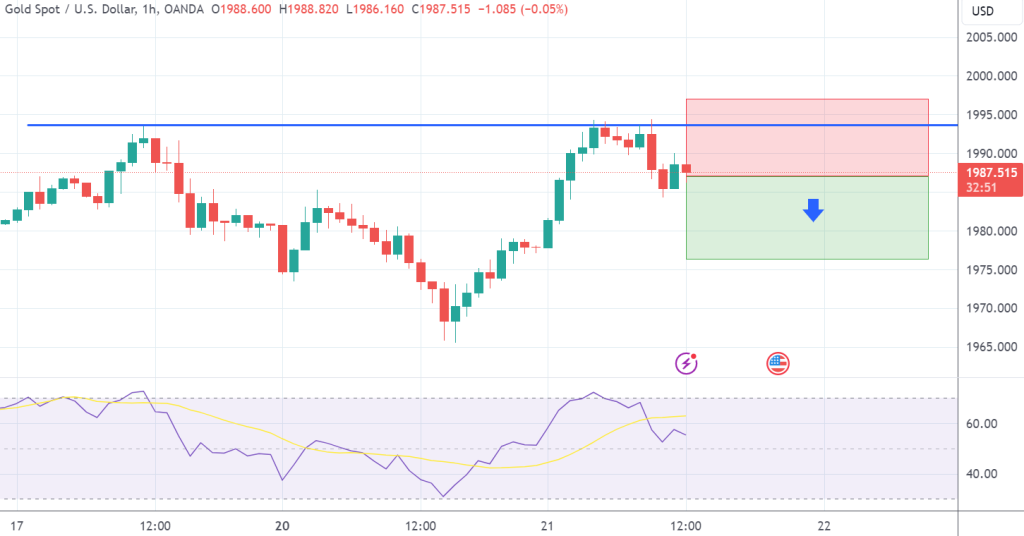
The recent price movement aligns seamlessly with my previous analysis. It successfully reached the predetermined target. The market is progressing towards the crucial resistance level.…
Technical Analysis for XAU/USD (Gold/US Dollar) – 1-Hour Chart At the time of analysis, XAU/USD is trading at 1977.45. OSCILLATORS: Buy: Exponential Moving Average…
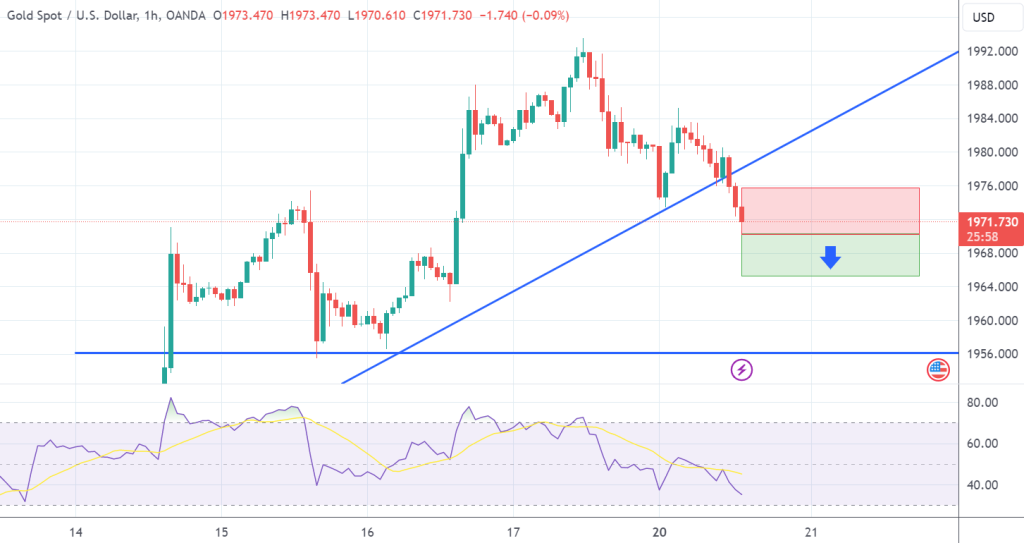
SELL at 1970.50 T/P: 1965.50 S/L: 1975.50 #XAUUSD hit T/P Price with +500 PIPs Profit
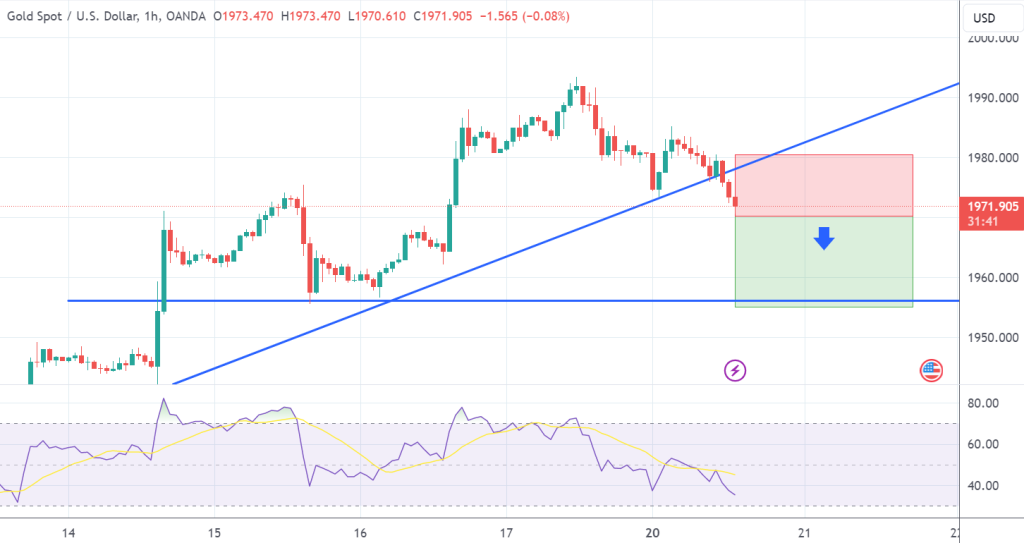
SELL at 1970.00 T/P 1: 1965.00 T/P 2: 1960.00 T/P 3: 1955.00 S/L: 1980.00 #XAUUSD hit T/P Price with +500 PIPs Profit