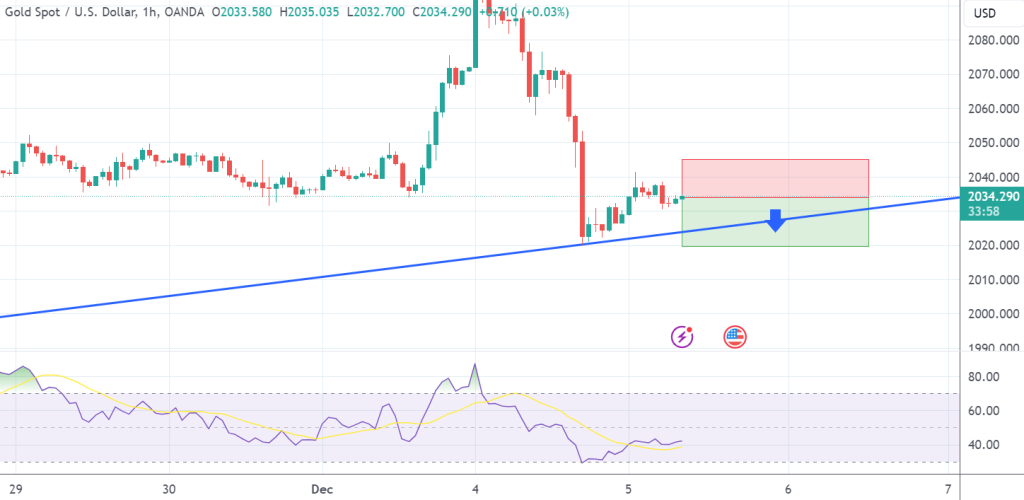
SELL at 2032.50 T/P 1: 2027.50 T/P 2: 2022.50 T/P 3: 2017.50 S/L: 2042.50 #XAUUSD hit T/P 3 Price with +1.500 PIPs Profit
Author: GOLD Signals TEAM

SELL at 2057.00 T/P 1: 2052.00 T/P 2: 2047.00 S/L: 2067.00 #XAUUSD hit T/P 2 Price with +1.000 PIPs Profit
Technical Analysis for XAU/USD (Gold/US Dollar) – 1-Hour Chart At the time of analysis, XAU/USD is trading at 2067.19. OSCILLATORS: Buy: Bull Bear Power,…
The recent price action aligns seamlessly with my previous analysis. The price has encountered a formidable resistance zone spanning from 2100 to 2120. Notably, the…
Gold is in a consolidation phase following an upward impulse. The ongoing consolidation is likely to persist due to the presence of a robust resistance…
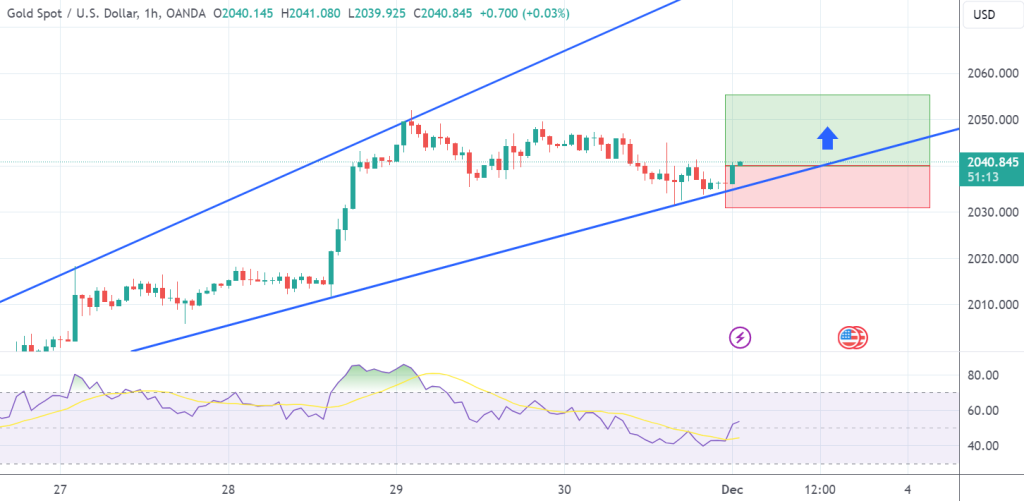
BUY at 2041.50 T/P 1: 2046.50 T/P 2: 2051.50 T/P 3: 2056.50 S/L: 2031.50 #XAUUSD hit T/P 3 Price with +1.500 PIPs Profit
Technical Analysis for XAU/USD (Gold/US Dollar) – 1-Hour Chart. At the time of analysis, XAU/USD is trading at 2040.60. OSCILLATORS: Buy: Momentum (10), MACD…
Total Profit in November: +12.000 PIPs GOLD Signal – 2.11.2023 | S/L: -1.000 PIPs GOLD Signal – 3.11.2023 | S/L: -1.000 PIPs GOLD Signal –…
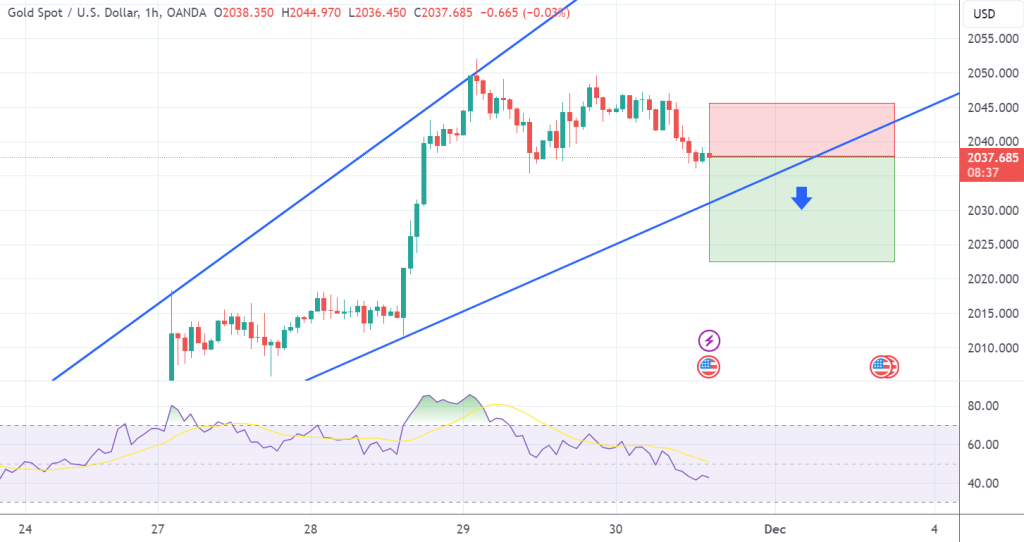
SELL at 2037.00 T/P 1: 2032.00 T/P 2: 2027.00 T/P 3: 2022.00 S/L: 2047.00
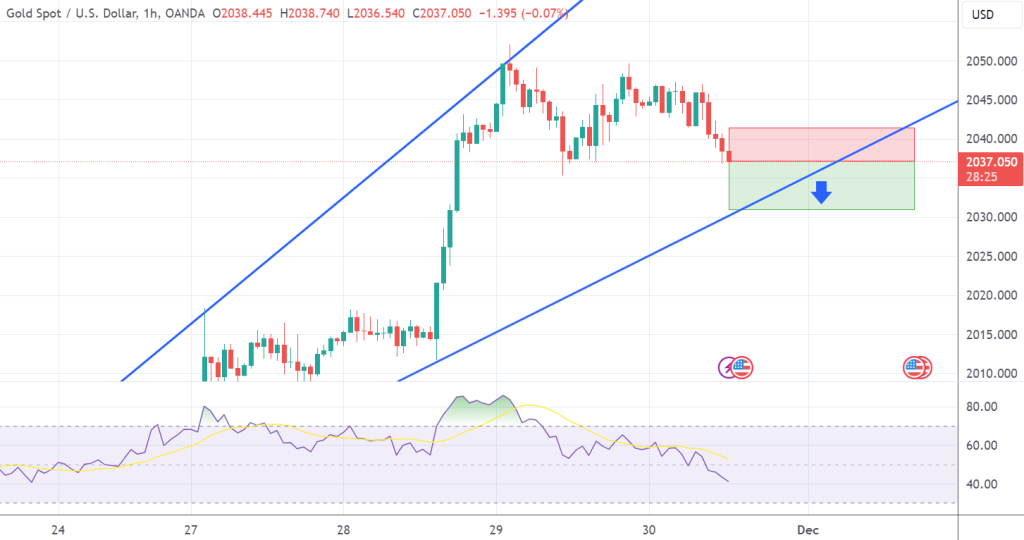
SELL at 2036.00 T/P: 2031.00 S/L: 2041.00 #XAUUSD hit S/L Price with -500 PIPs Profit