The strong resistance zone has been touched, and there was a rebound. XAUUSD had previously retraced from this level. The price has created a potential…
Author: GOLD Signals TEAM
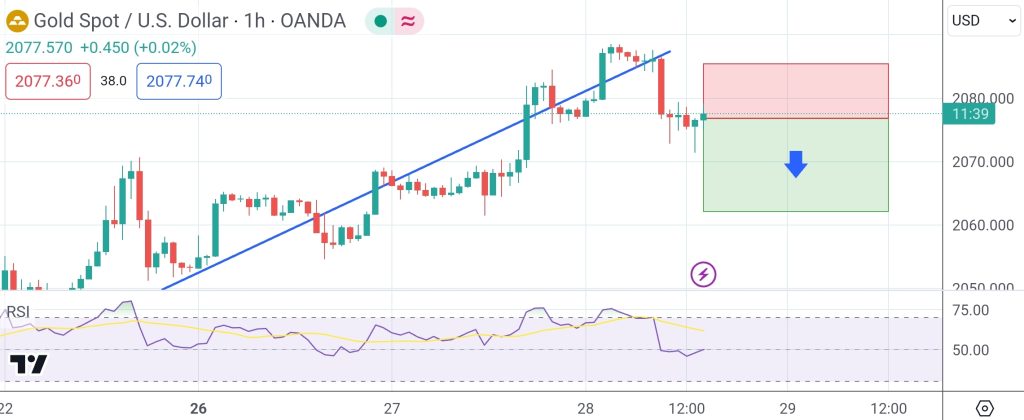
SELL at 2076.00 T/P 1: 2071.00 T/P 2: 2066.00 T/P 3: 2061.00 S/L: 2086.00 #XAUUSD hit T/P 3 Price with +1.500 PIPs Profit
The execution of my previous analysis is perfect. We reached the target. Gold has reached a significant resistance zone. There is a lot of selling…
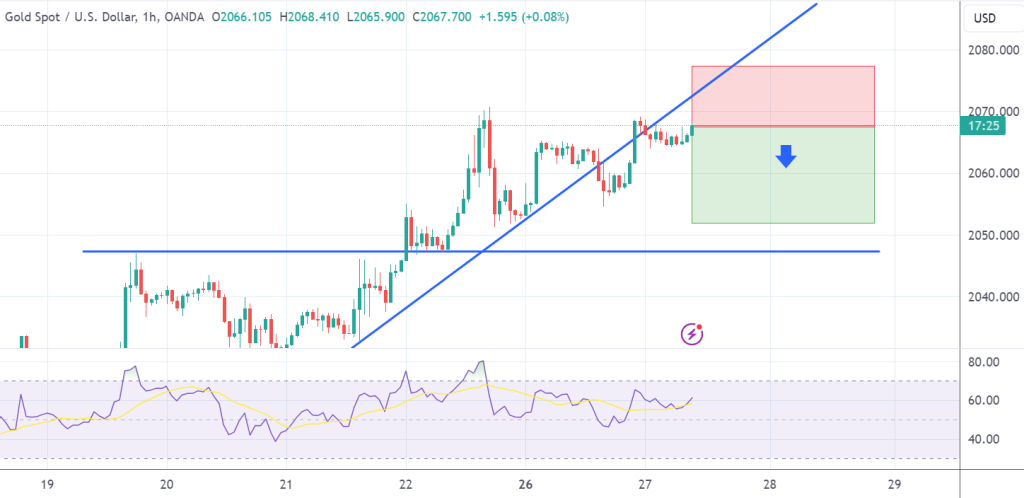
SELL at 2067.00 T/P 1: 2062.00 T/P 2: 2057.00 T/P 3: 2052.00 S/L: 2077.00 #XAUUSD hit T/P 1 Price with +500 PIPs Profit
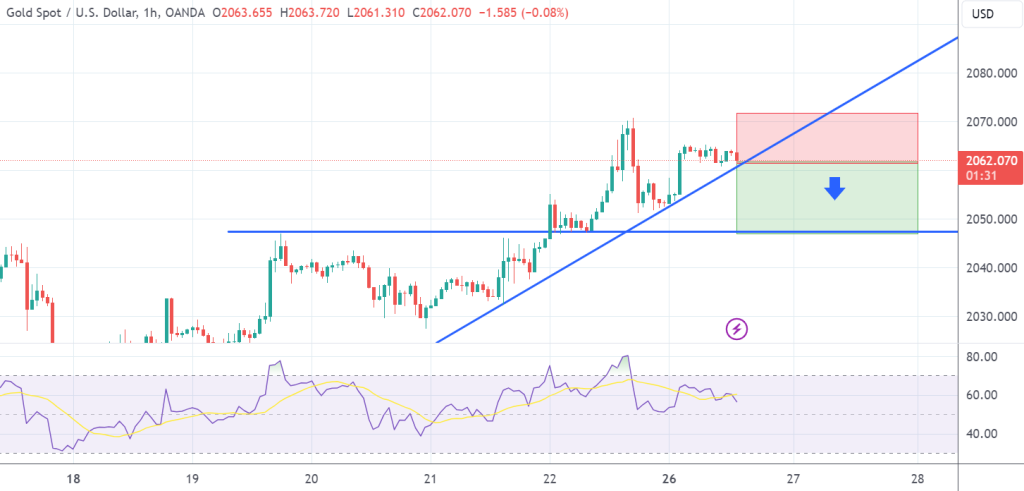
The execution of my previous analysis is on point. XAUUSD shaped an ascending triangle and successfully breached it. The market broke and stabilized above the…
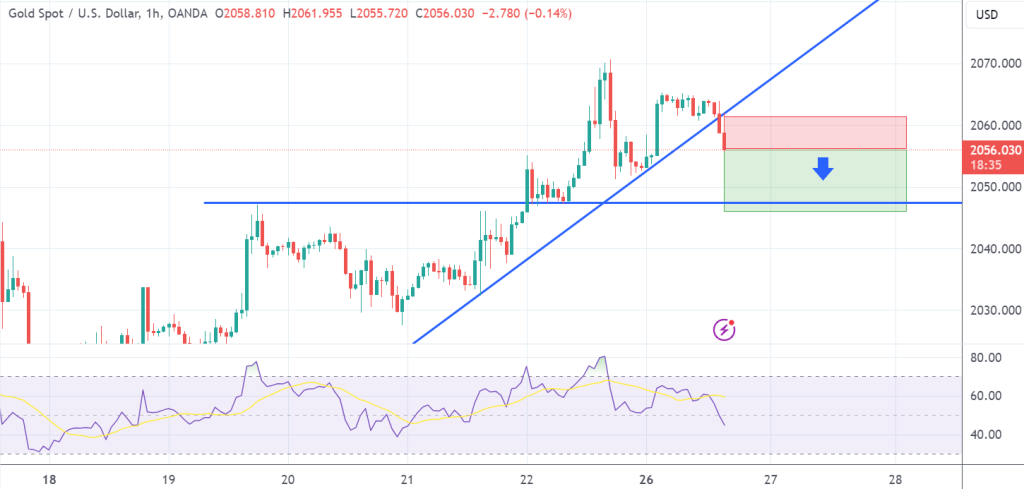
SELL at 2054.00 T/P 1: 2049.00 T/P 2: 2044.00 S/L: 2064.00 #XAUUSD Update: Cancelled
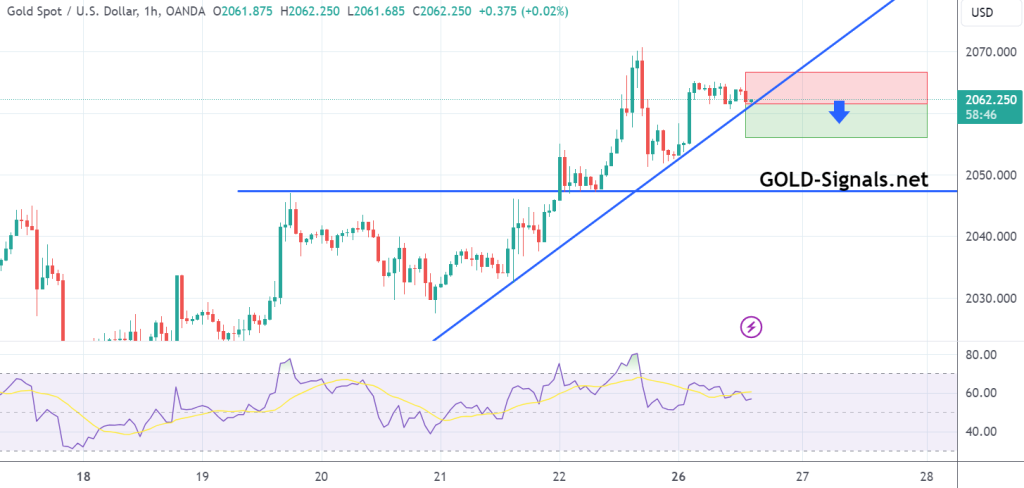
SELL at 2061.00 T/P: 2056.00 S/L: 2066.00 #XAUUSD hit T/P Price with +500 PIPs Profit
SELL at 2061.00 T/P 1: 2056.00 T/P 2: 2051.00 T/P 3: 2046.00 S/L: 2071.00 #XAUUSD hit T/P 1 Price with +500 PIPs Profit
Technical Analysis for XAU/USD (Gold) – 1-Hour Chart Current Price: $20632.62 (As of 12:02 PM) Oscillators: Relative Strength Index (RSI): 59.770 (Neutral) Stochastic %K:…
An additional indication supporting the potential uptrend in Gold prices during the trading week of December 25 — 29, 2023, would be a rebound from…