The forecast and analysis of gold for January 4, 2024, anticipate an attempt to develop a price correction and test the support area near the…
Author: GOLD Signals TEAM
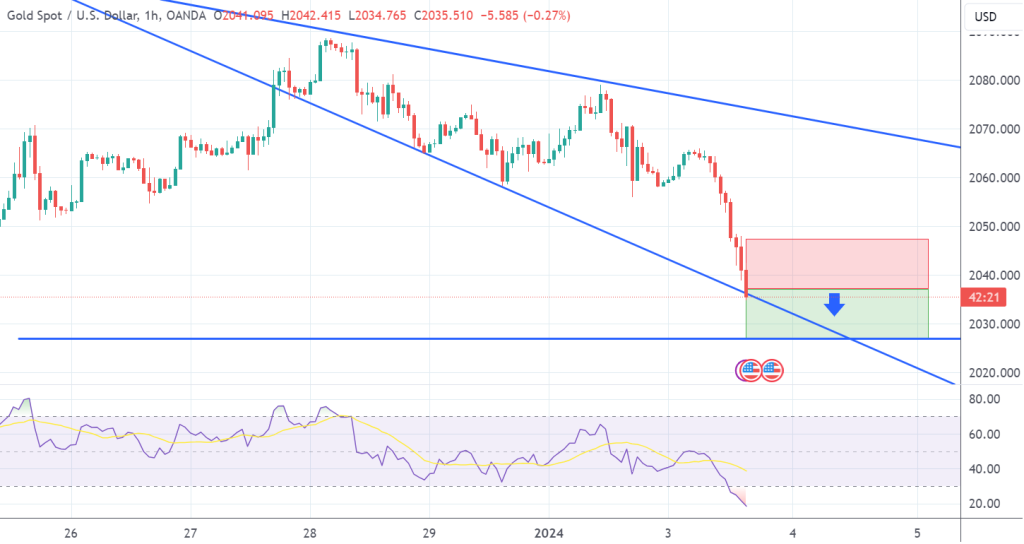
SELL at 2035.00 T/P 1: 2030.00 T/P 2: 2025.00 S/L: 2045.00 #XAUUSD hit S/L Price with -1.000 PIPs Loss
The XAU/USD Market, currently priced at $2054.60, presents a mixed technical outlook. While oscillators signal a neutral stance with a slight bearish bias, the moving…
Current Price: $2054.60 (As of 11:06 AM) Oscillators: Relative Strength Index (RSI): 33.484 (Neutral) Stochastic %K: 17.731 (Neutral) Commodity Channel Index (CCI): -178.675 (Buy)…
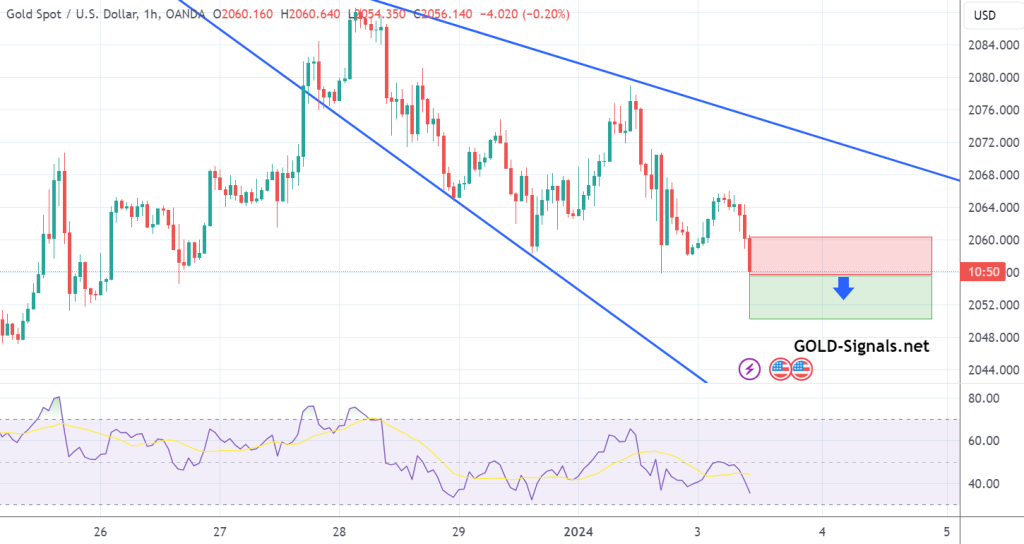
SELL at 2055.00 T/P: 2050.00 S/L: 2060.00 #XAUUSD hit T/P Price with +500 PIPs Profit
SELL at 2055.00 T/P 1: 2050.00 T/P 2: 2045.00 T/P 3: 2040.00 T/P 4: 2035.00 S/L: 2070.00 #XAUUSD hit T/P 4 Price with +2.000 PIPs…
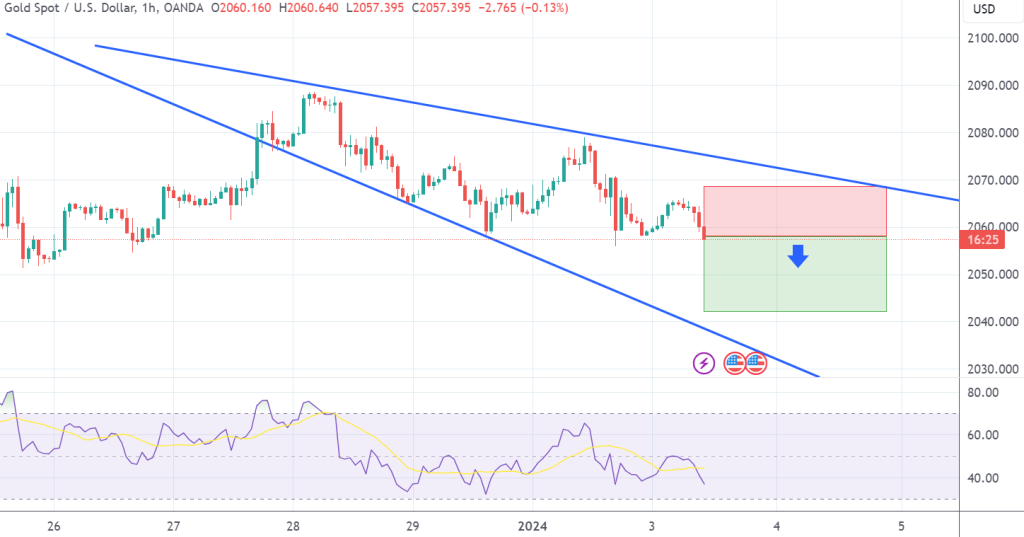
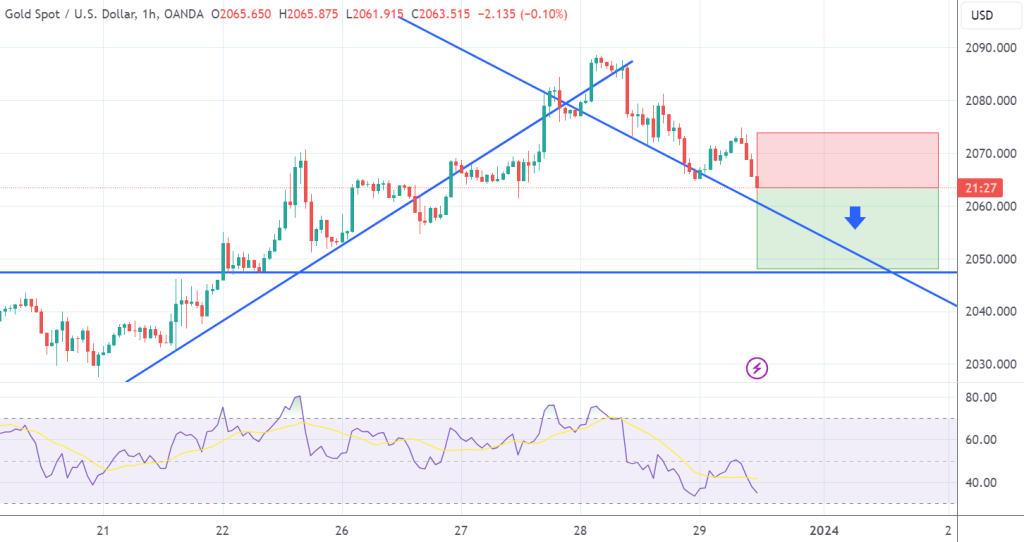
Technical Analysis for XAU/USD (Gold) – 1-Hour Chart Current Price: $2059.00 (As of 21:16 PM) Oscillators: Relative Strength Index (RSI): 39.621 (Neutral) Stochastic %K:…
SELL at 2057.00 T/P 1: 2052.00 T/P 2: 2047.00 T/P 3: 2042.00 S/L: 2067.00 #XAUUSD hit T/P 3 Price with +1.500 PIPs Profit
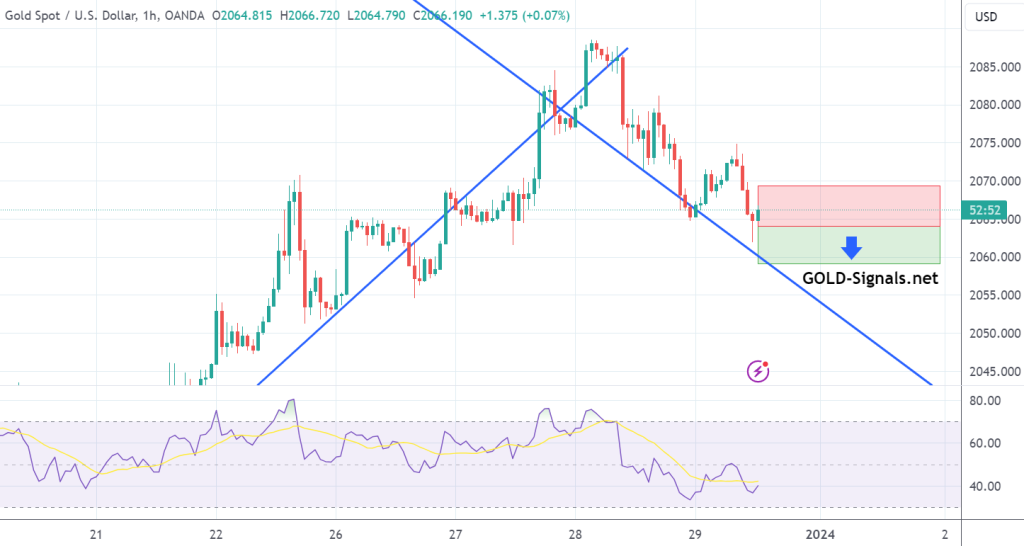
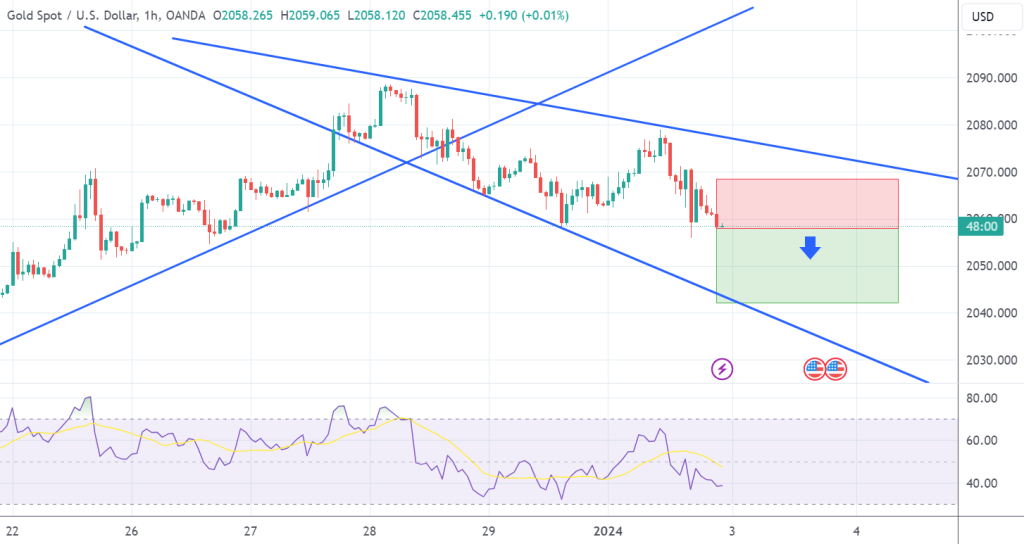
SELL at 2064.00 T/P: 2059.00 S/L: 2069.00 #XAUUSD hit T/P Price with +500 PIPs Profit
SELL at 2062.00 T/P 1: 2057.00 T/P 2: 2052.00 T/P 3: 2047.00 S/L: 2072.00 #XAUUSD hit S/L Price with -1.000 PIPs Loss