Technical Analysis for XAU/USD – 1-Hour Chart Oscillators Summary: Buy: Momentum (10), MACD Level (12, 26) Sell: Bull Bear Power Neutral: RSI (14), Stochastic…
Author: GOLD Signals TEAM
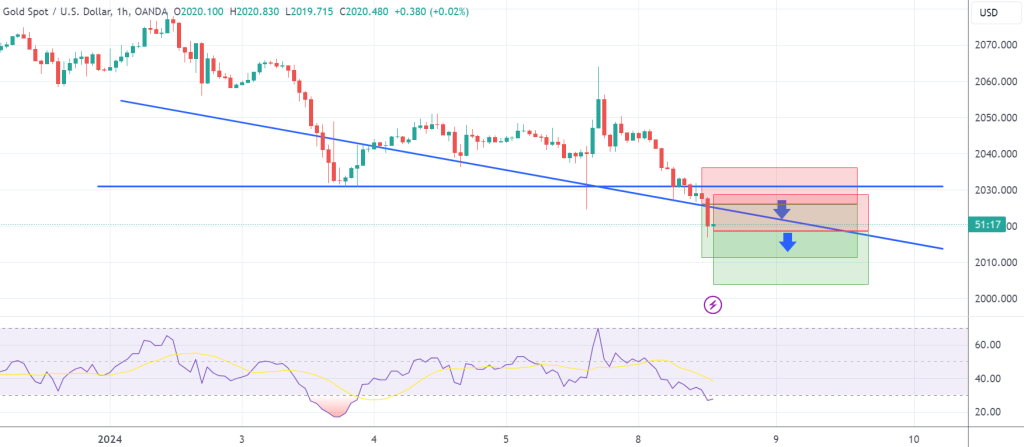
SELL at 2019.00 T/P 1: 2014.00 T/P 2: 2009.00 S/L: 2034.00 #XAUUSD hit S/L Price with -1.000 PIPs Loss
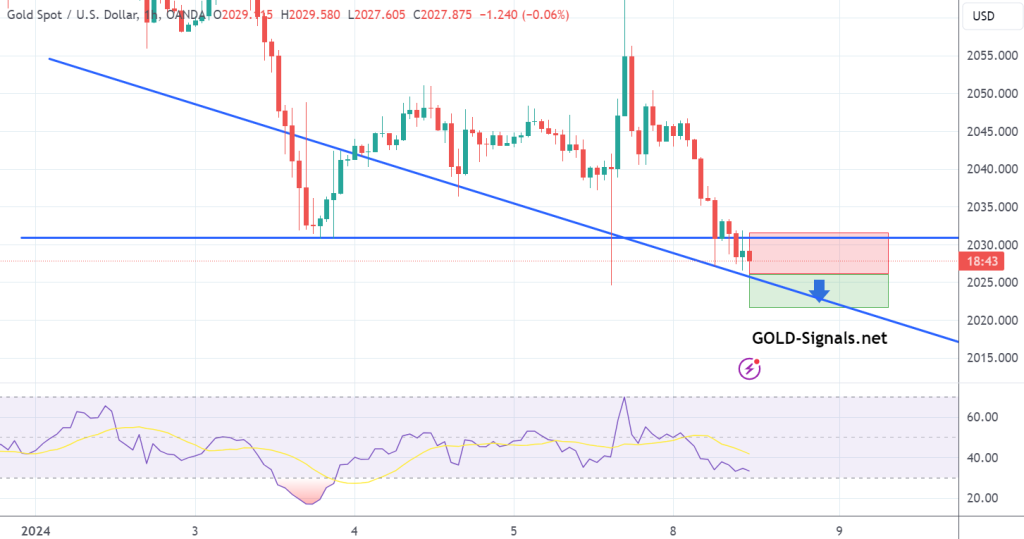
SELL at 2026.00 T/P: 2021.00 S/L: 2033.00 #XAUUSD hit T/P Price with +500 PIPs Profit
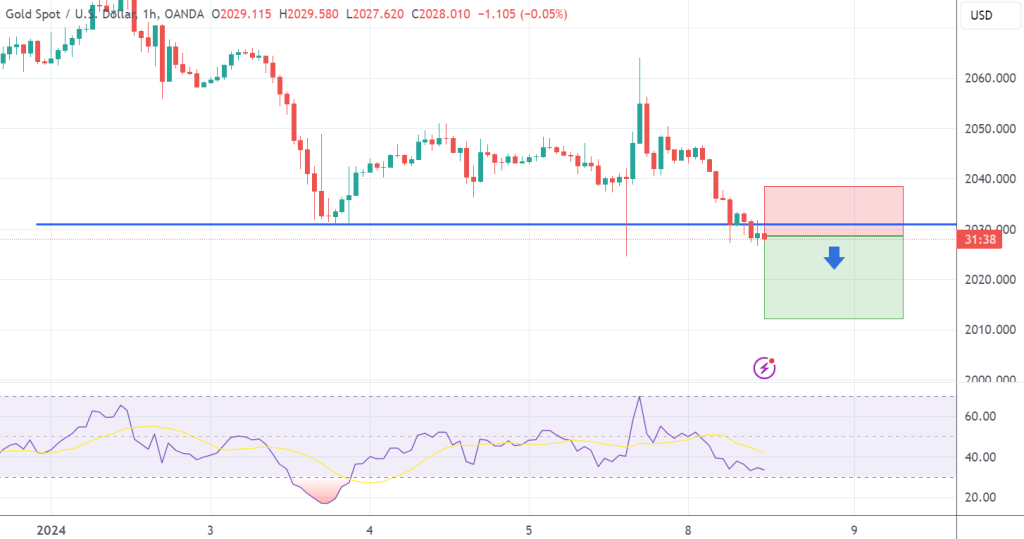
SELL at 2026.00 T/P 1: 2021.00 T/P 2: 2016.00 T/P 3: 2011.00 S/L: 2041.00 #XAUUSD hit T/P 2 Price with +1.000 PIPs Profit
Indicators point towards a potential uptick in Gold prices during the trading week of January 8-12, 2024. Look for a bounce off the support line…
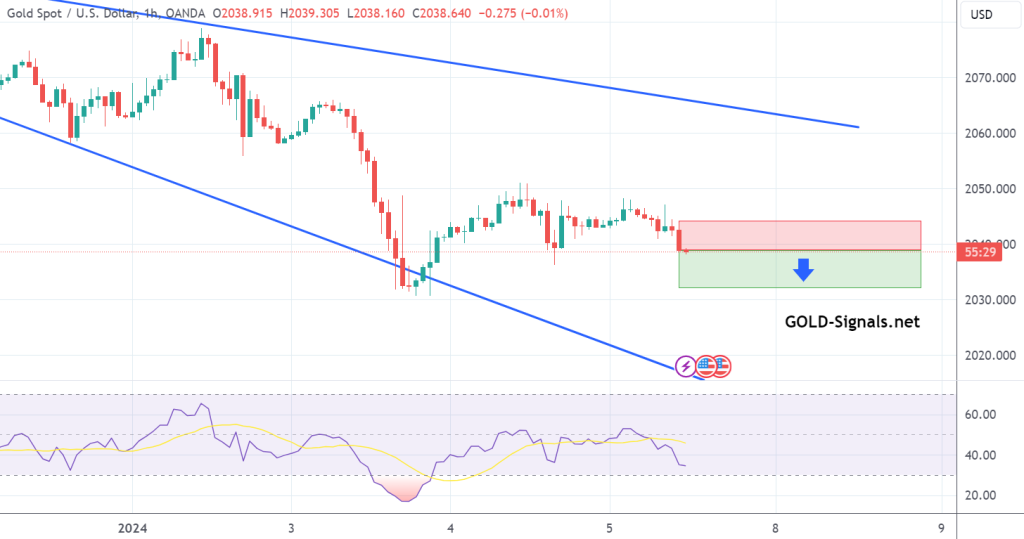
SELL at 2037.00 T/P: 2032.00 S/L: 2042.00 #XAUUSD hit T/P Price with +500 PIPs Profit

SELL at 2037.00 T/P 1: 2032.00 T/P 2: 2027.00 T/P 3: 2022.00 S/L: 2047.00 #XAUUSD hit T/P 2 Price with +1.000 PIPs Profit
Anticipates a potential correction, testing support around 2025. Expects ongoing growth in non-ferrous metal prices targeting above 2155. Failure to raise Gold prices will result…
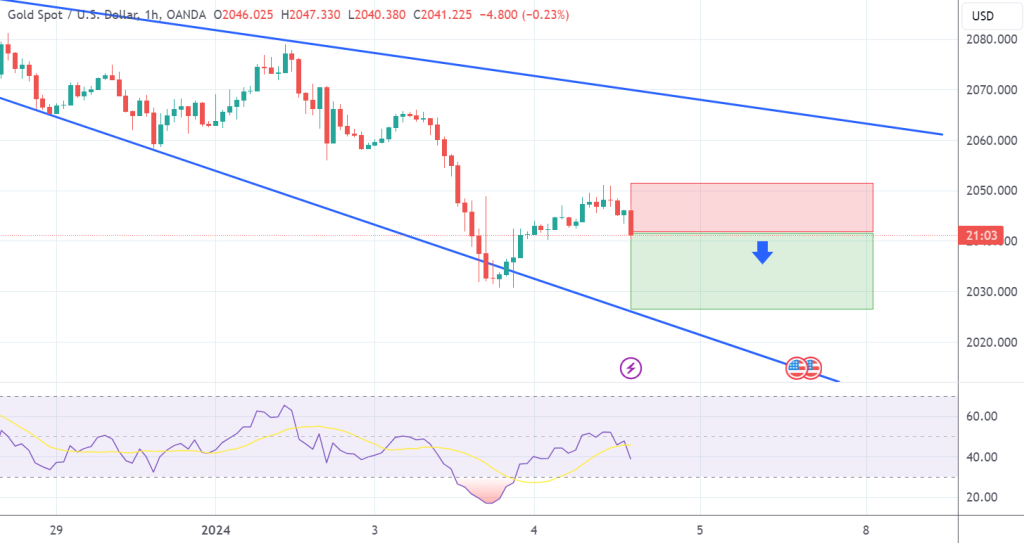
SELL at 2040.00 T/P 1: 2035.00 T/P 2: 2030.00 T/P 3: 2025.00 S/L: 2050.00 #XAUUSD hit T/P 3 Price with +1.500 PIPs Profit
Total Profit in December: +16.000 PIPs GOLD Signal – 1.12.2023 | T/P 3: +1.500 PIPs GOLD Signal – 4.12.2023 | T/P 2: +1.000 PIPs GOLD…