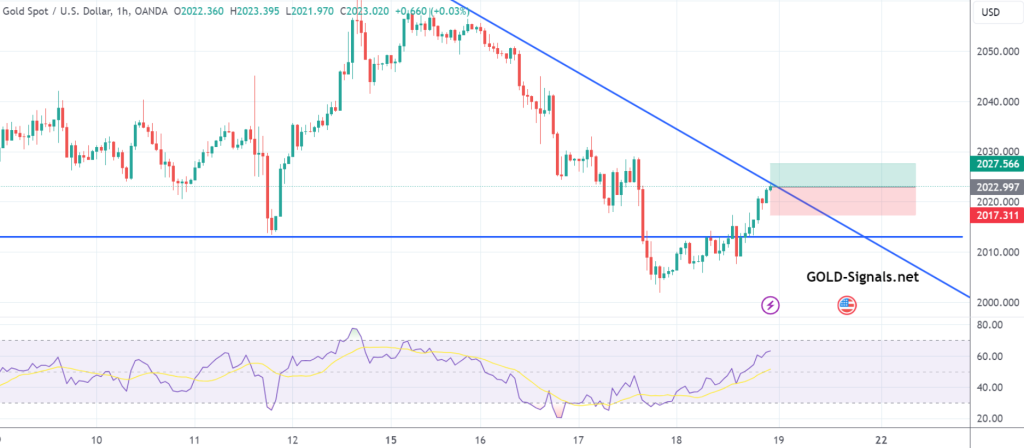
BUY at 2024.50 T/P: 2029.50 S/L: 2019.50 #XAUUSD hit T/P Price with +500 PIPs Profit
Author: GOLD Signals TEAM
BUY at 2024.50 T/P 1: 2029.50 T/P 2: 2034.50 T/P 3: 2039.50 S/L: 2014.50 #XAUUSD hit T/P 2 Price with +1.000 PIPs Profit
#GOLD 1-hour chart at $2023.02 presents a mixed picture. While oscillators offer conflicting signals, shorter-term moving averages indicate a potential buy, but caution is advised…
Technical Analysis for XAU/USD – 1-Hour Chart (22:05 PM, $2023.02) OSCILLATORS: BUY: MACD Level (12, 26), Bull Bear Power. SELL: Commodity Channel Index (20),…
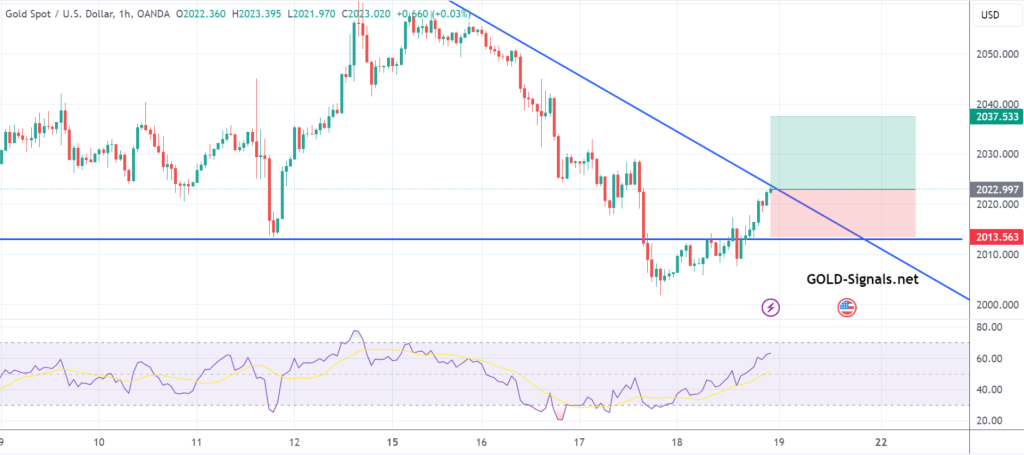
BUY at 2013.50 T/P 1: 2018.50 T/P 2: 2023.50 T/P 3: 2028.50 S/L: 1998.50 #XAUUSD hit T/P 3 Price with +1.500 PIPs Profit
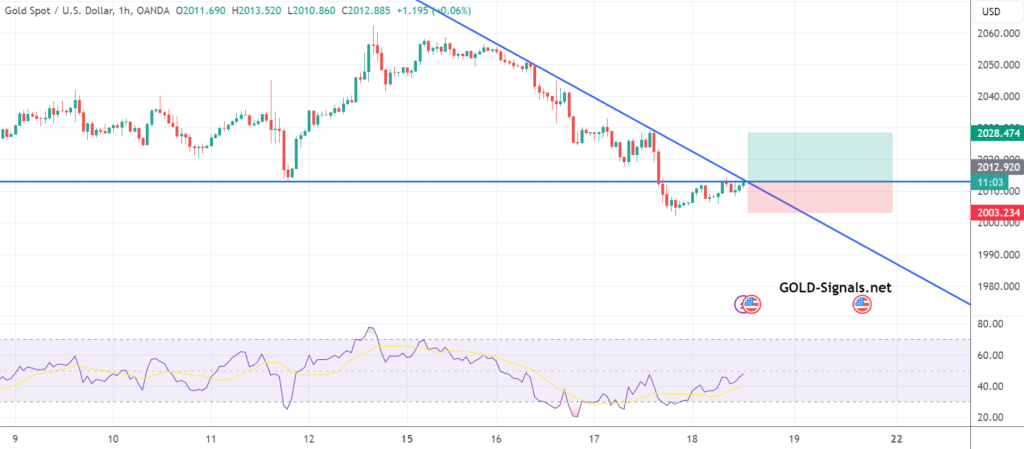
Technical analysis for XAU/USD on the 1-hour chart at 11:22 AM, priced at $2012.37, indicates a predominant bearish trend. Oscillators and moving averages support selling,…
XAU/USD Technical Analysis – 1-Hour Chart (As of 11:22 AM, Price: $2012.37) OSCILLATORS: RSI (14): 35.026 (Neutral) Stochastic %K (14, 3, 3): 18.731 (Neutral)…
Gold faced bearish pressure as it dropped below the 50-day SMA on Wednesday. Potential support zones stand at $1,990 and $1,975, with further downside focusing…

SELL at 2010.00 T/P 1: 2005.00 T/P 2: 2000.00 T/P 3: 1995.00 S/L: 2020.00 #XAUUSD hit T/P Price with +500 PIPs Profit
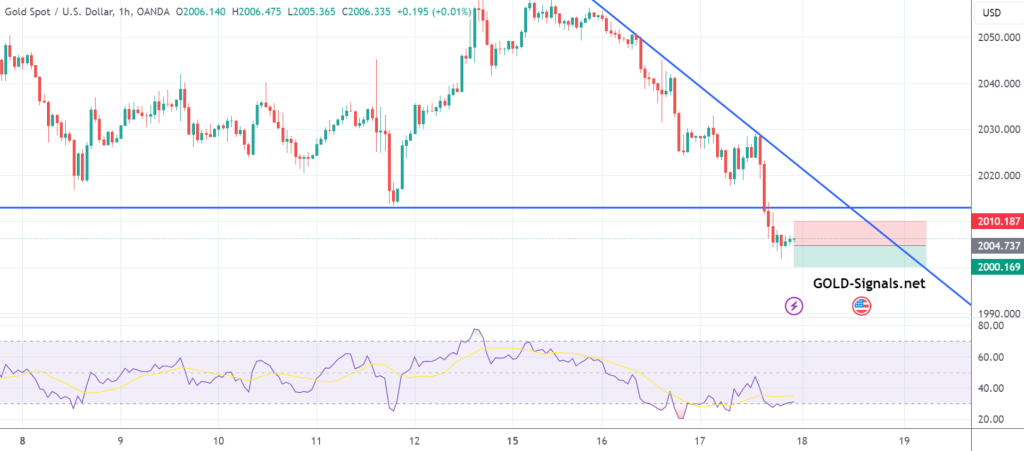
SELL at 2005.00 T/P: 2000.00 S/L: 2010.00 #XAUUSD hit S/L Price with -500 PIPs Loss