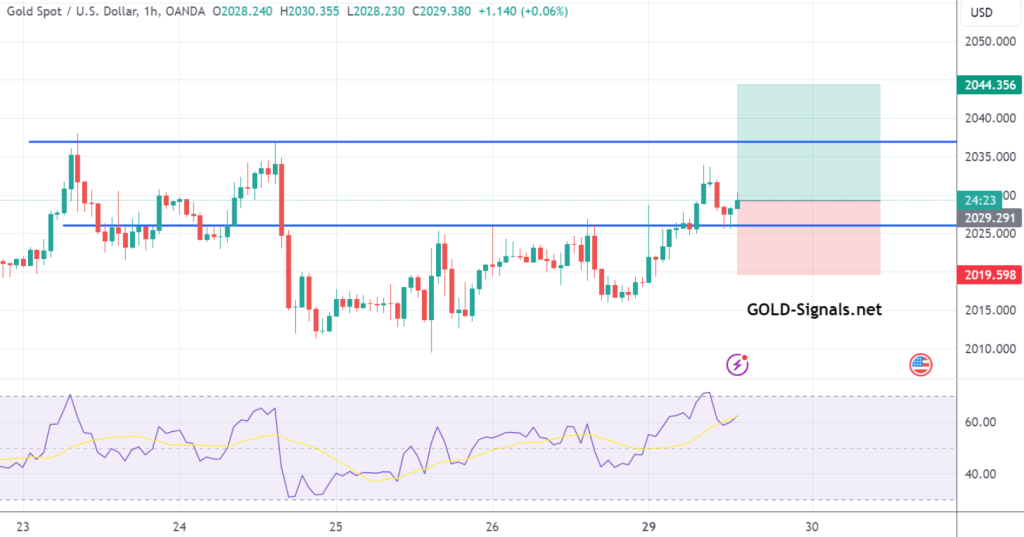
BUY at 2030.00 T/P 1: 2035.00 T/P 2: 2040.00 T/P 3: 2045.00 S/L: 2020.00 #XAUUSD hit T/P 3 Price with +1.500 PIPs Profit
Author: GOLD Signals TEAM
Technical Analysis for XAU/USD (Gold Market) – 1-Hour Chart Oscillators Summary: Buy (4): MACD Level, Exponential Moving Average (20), Simple Moving Average (20), Exponential…
Signs pointing to a potential rise in Gold prices this week include a rebound from RSI support and the upper border of a descending channel.…
The #GOLD 1-hour chart displays mixed signals, making it challenging to determine a clear trend. Oscillators show conflicting buy and sell indications, moving averages present…
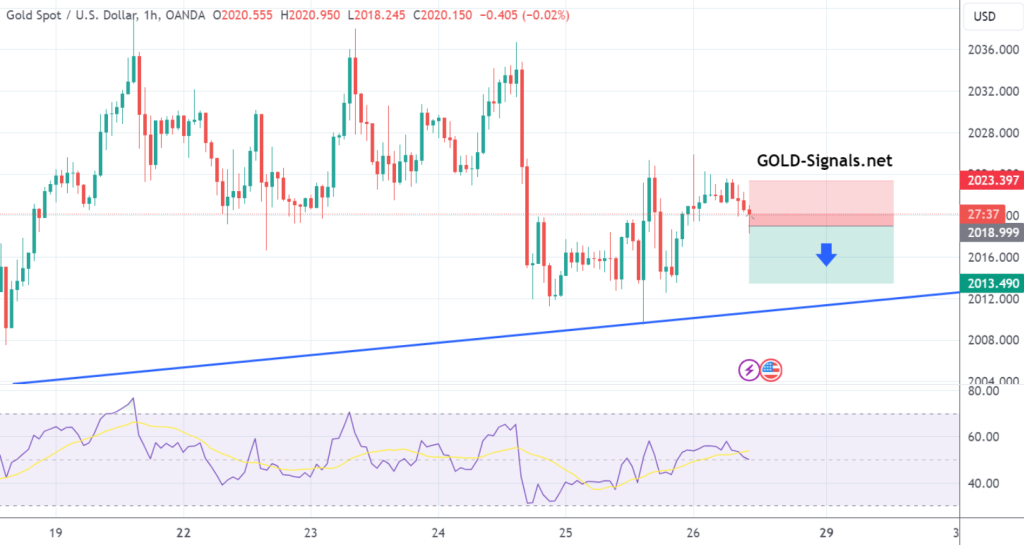
SELL at 2018.00 T/P: 2013.00 S/L: 2023.00 #XAUUSD hit S/L Price with -500 PIPs Loss
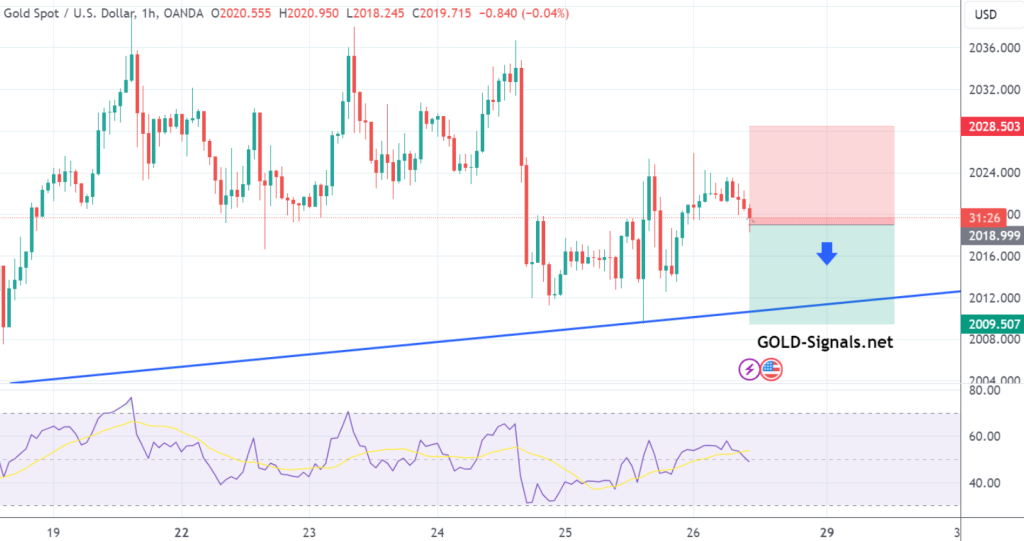
SELL at 2019.00 T/P 1: 2014.00 T/P 2: 2009.00 T/P 3: 2004.00 S/L: 2029.00 #XAUUSD hit T/P 1 Price with +500 PIPs Profit
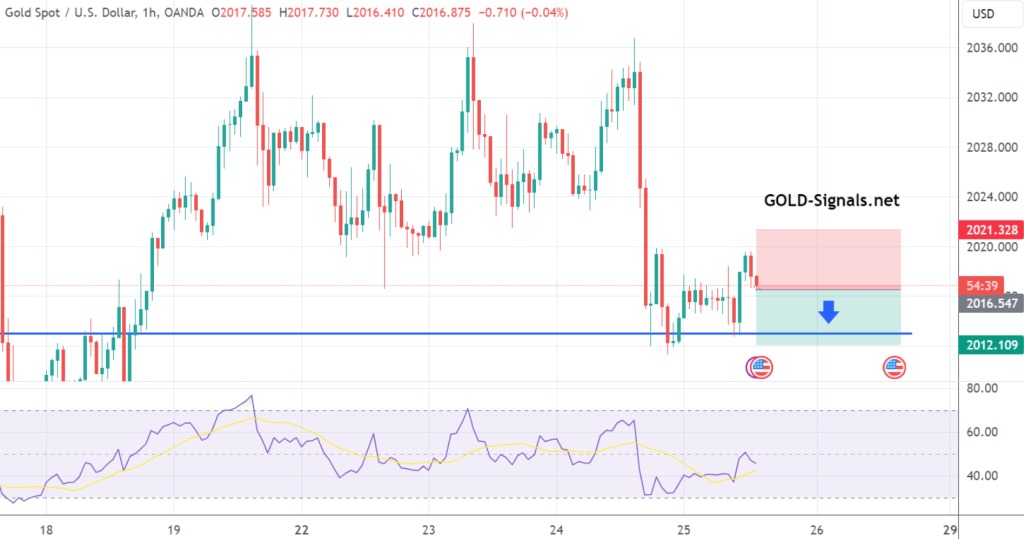
SELL at 2016.00 T/P: 2011.00 S/L: 2021.00 #XAUUSD hit T/P Price with +500 PIPs Profit
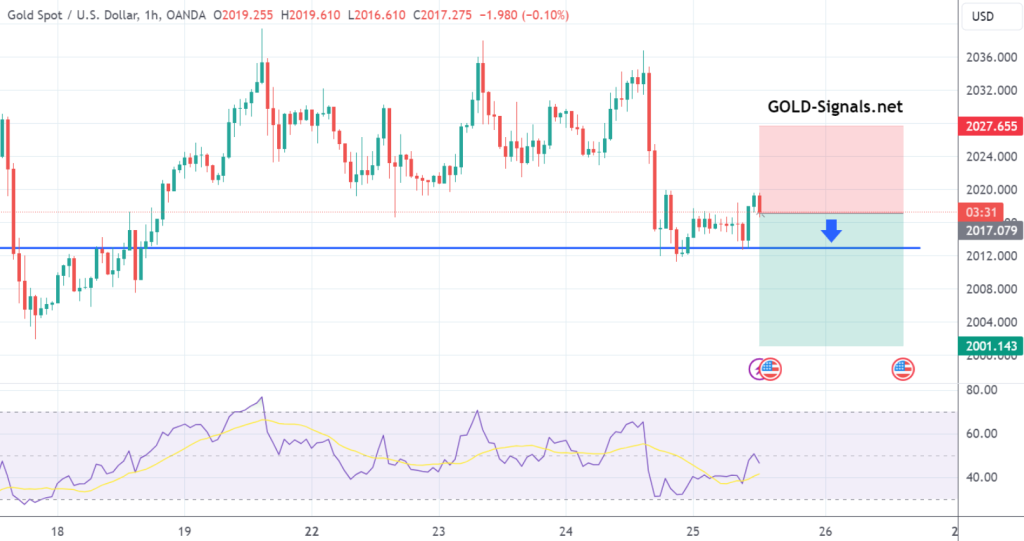
SELL at 2016.50 T/P 1: 2011.50 T/P 2: 2006.50 T/P 3: 2001.50 S/L: 2026.50 #XAUUSD hit T/P Price with +500 PIPs Profit
The GOLD 1-hour chart analysis suggests mixed signals. Oscillators provide a slight bias towards buying, while moving averages indicate bullish tendencies. Pivot points offer diverse…
Technical Analysis for XAU/USD (Gold) Market – 1-Hour Chart Current Price (XAU/USD): $2014.42 (as of 08:31 AM) Oscillators: Buy: Stochastic %K, Bull Bear Power,…