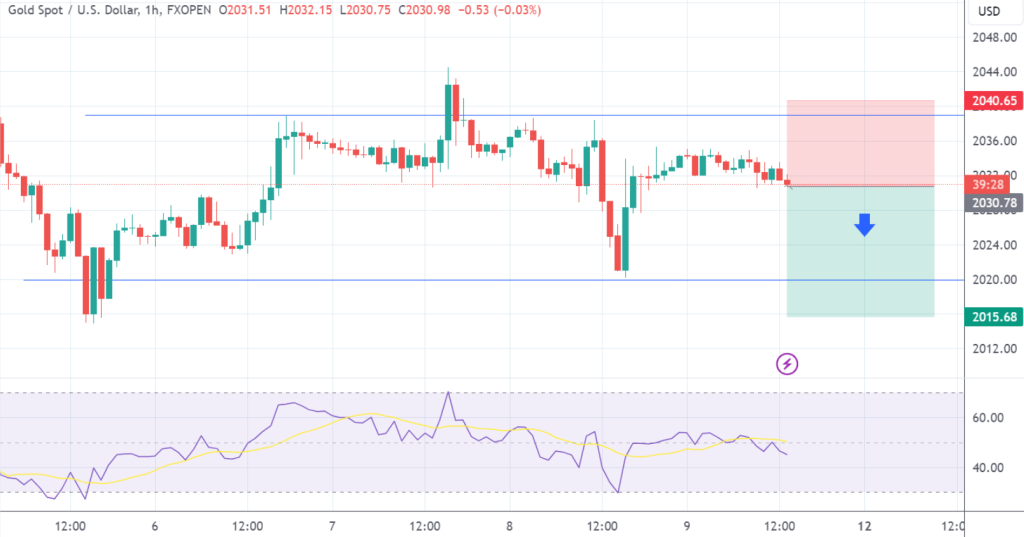
SELL at 2030.00 T/P 1: 2025.00 T/P 2: 2020.00 T/P 3: 2015.00 S/L: 2040.00 #XAUUSD hit T/P 3 Price with +1.500 PIPs Profit
Author: GOLD Signals TEAM
The technical analysis for XAU/USD on the 1H chart suggests a bearish sentiment overall. Most oscillators, including Momentum, MACD, and Awesome Oscillator, indicate sell signals,…
Technical Analysis for XAU/USD on 1H Chart Summary: Oscillators: Majority of oscillators suggest a bearish sentiment, with Momentum, MACD, and Awesome Oscillator indicating sell signals.…
Technical Analysis for XAU/USD on 1H Chart Summary: Oscillators: Most oscillators indicate a neutral stance, with a slight bias towards selling from Momentum and…
The price has consistently followed my previous analysis. The market experienced a significant decline and reached the profit-taking level. XAUUSD has returned to the price…
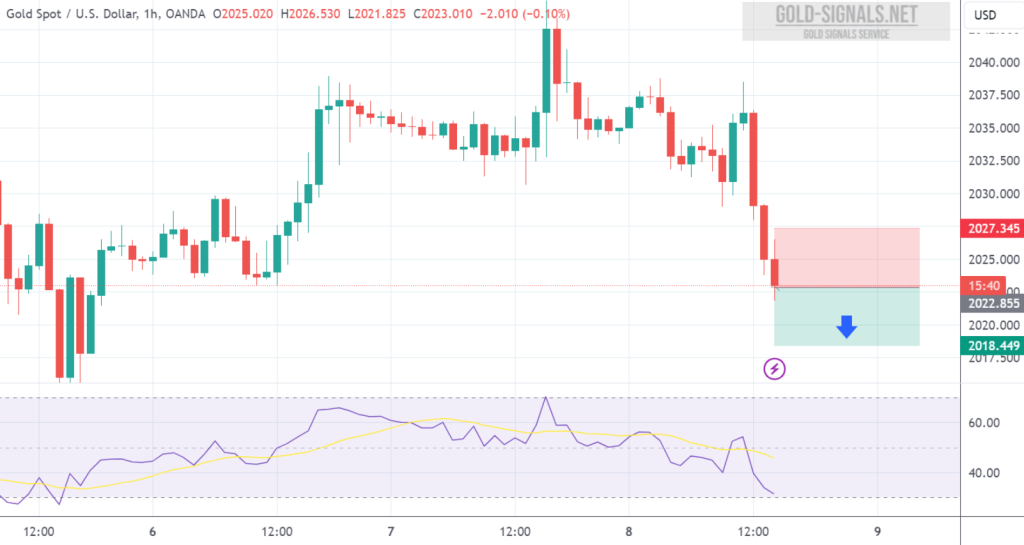
SELL at 2022.50 T/P: 2017.50 S/L: 2027.50 #XAUUSD hit S/L Price with -500 PIPs Loss
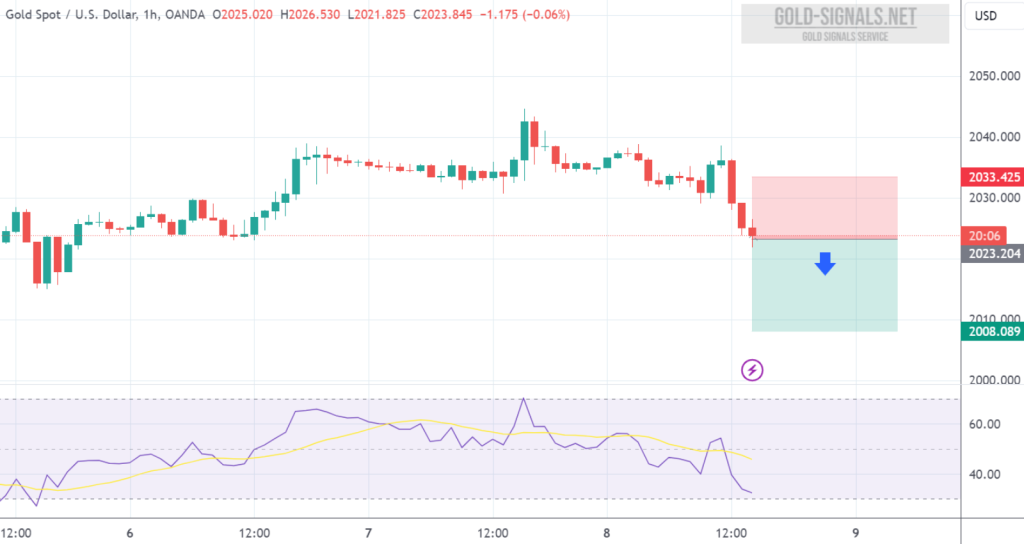
SELL at 2023.00 T/P 1: 2018.00 T/P 2: 2013.00 T/P 3: 2008.00 S/L: 2033.00 #XAUUSD hit S/L Price with -1.000 PIPs Loss
Technical Analysis for XAU/USD on 1H Chart Summary: Oscillators: Majority of oscillators indicate a neutral stance with slight buying bias from Momentum. MACD suggests…
The price rebounded from the support level and reached the target level. XAUUSD is trading within a range after returning to the range zone. It’s…
The technical analysis for #GOLD on the 1-hour chart presents a mixed outlook. While some indicators signal a BUY sentiment, including momentum and certain moving…