Based on technical analysis, GOLD shows mixed signals. While momentum indicators like MACD and Momentum suggest buying, the CCI indicates selling pressure. Moving averages support…
Author: GOLD Signals TEAM
Based on the technical analysis of XAU/USD, the market sentiment appears mixed but leans slightly towards a bullish bias. Oscillators Summary: Momentum and MACD…
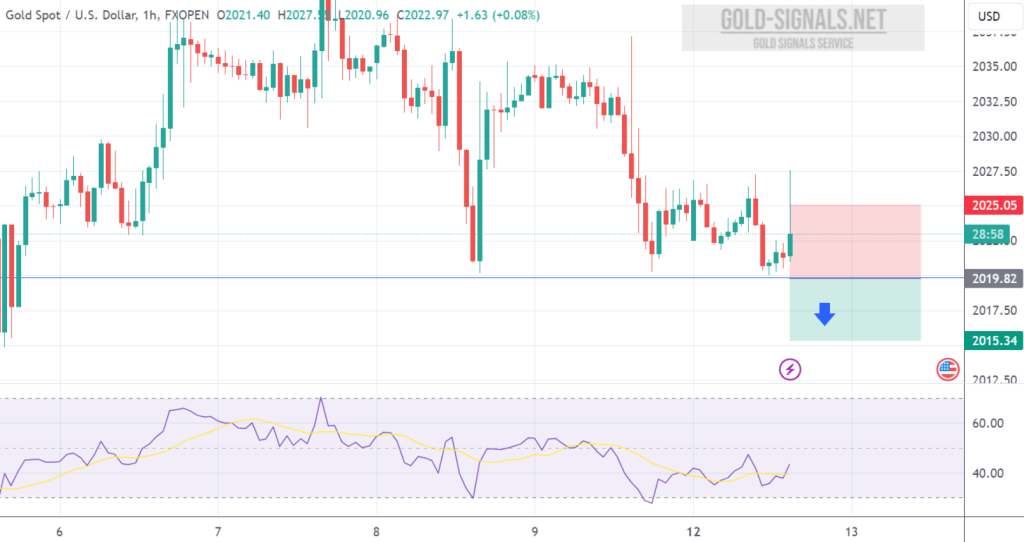
SELL at 2020.00 T/P: 2015.00 S/L: 2025.00 #XAUUSD hit T/P Price with +500 PIPs Profit
Technical Analysis of XAU/USD: Summary: The technical analysis of XAU/USD reveals a mixed sentiment, with oscillators and pivot points suggesting a bearish bias, while the…
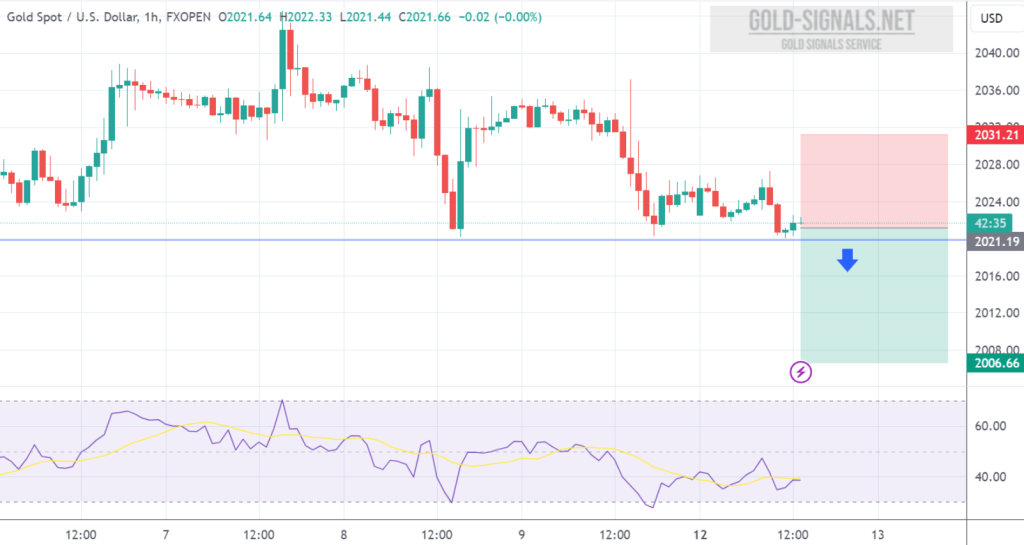
SELL at 2021.00 T/P 1: 2016.00 T/P 2: 2011.00 T/P 3: 2006.00 S/L: 2031.00 #XAUUSD hit T/P 3 Price with +1.500 PIPs Profit
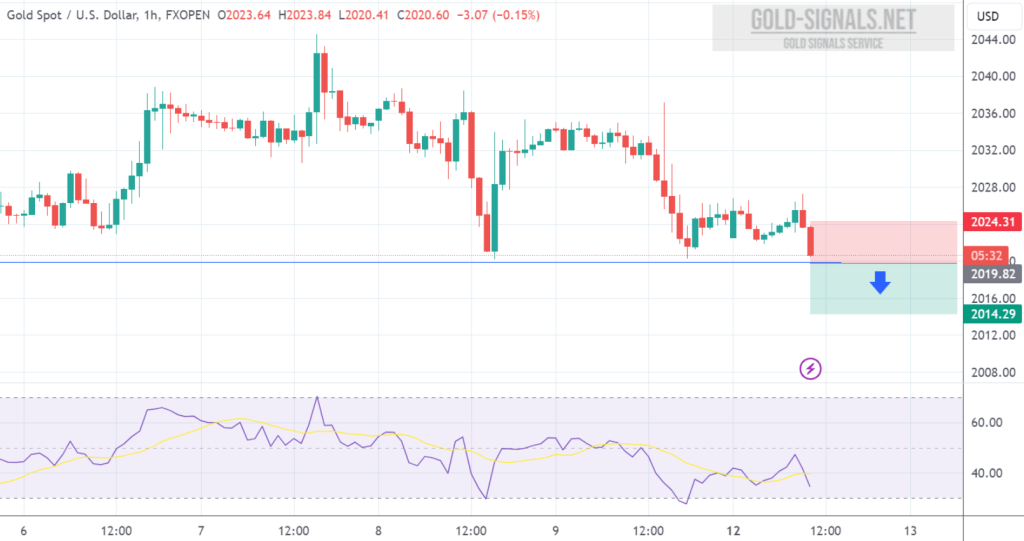
SELL at 2020.00 T/P: 2015.00 S/L: 2025.00 #XAUUSD hit T/P Price with +500 PIPs Profit
Technical Analysis of XAU/USD Summary: The technical analysis of XAU/USD suggests a predominantly bearish sentiment across oscillators, moving averages, and pivot points. However, the…
Technical Analysis of XAU/USD Summary: The technical analysis of XAU/USD suggests a predominantly bearish sentiment across oscillators, moving averages, and pivot points. However, the…
In the trading week starting February 12, 2024, anticipate a bullish momentum for Gold, validated by rebounds from RSI support and the upper border of…

SELL at 2030.00 T/P: 2025.00 S/L: 2035.00 #XAUUSD hit T/P Price with +500 PIPs Profit