Technical Analysis for XAU/USD (Gold Market) – 1-Hour Chart Oscillators Summary: Buy: None Sell: Momentum (10), MACD Level (12, 26) Market Direction According to…
Author: GOLD Signals TEAM
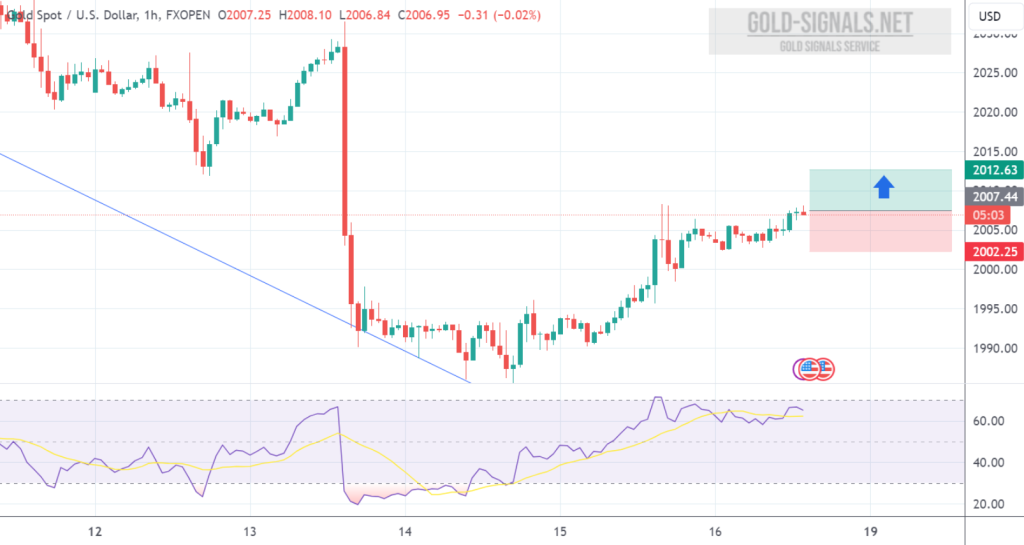
BUY at 2008.50 T/P: 2013.50 S/L: 1998.50 #XAUUSD hit T/P Price with +500 PIPs Profit
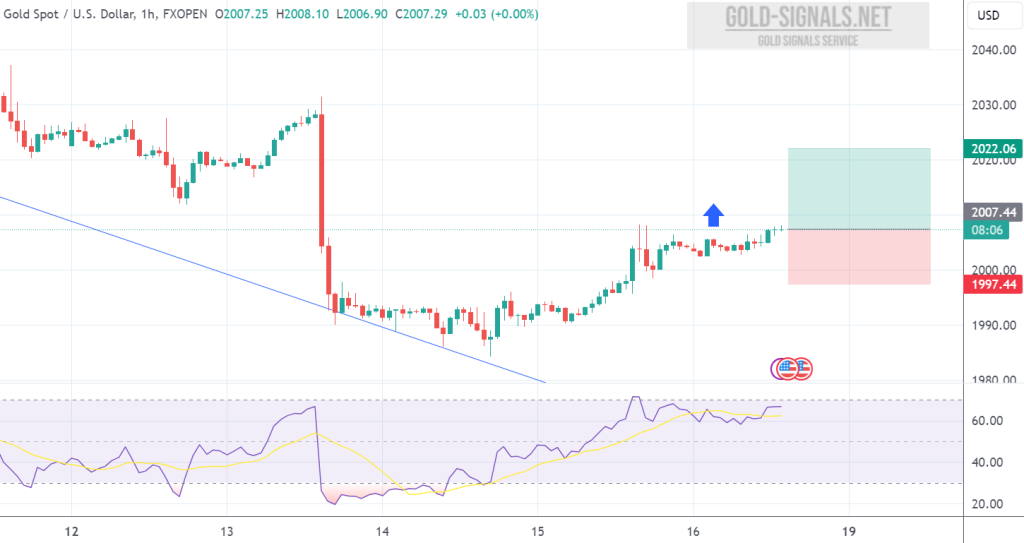
BUY at 2008.50 T/P 1: 2013.50 T/P 2: 2018.50 T/P 3: 2023.50 S/L: 1998.50 #XAUUSD hit T/P 3 Price with +1.500 PIPs Profit
GOLD shows a predominantly bullish outlook on the 1-hour chart. Oscillators indicate buying pressure, supported by moving averages and pivot points signaling a bullish trend.…
Technical Analysis for XAU/USD (Gold Market) – 1-Hour Chart Oscillators Summary: Buy: Momentum (10), MACD Level (12, 26) Sell: Exponential Moving Average (200), Simple…
Based on oscillators, moving averages, and pivot points, GOLD shows a neutral to bullish trend. While oscillators indicate a neutral stance, moving averages suggest a…
Oscillators: Out of the 11 oscillators available, five indicate a buy (BUY), while five indicate a sell (SELL). Therefore, the trend according to the oscillators…
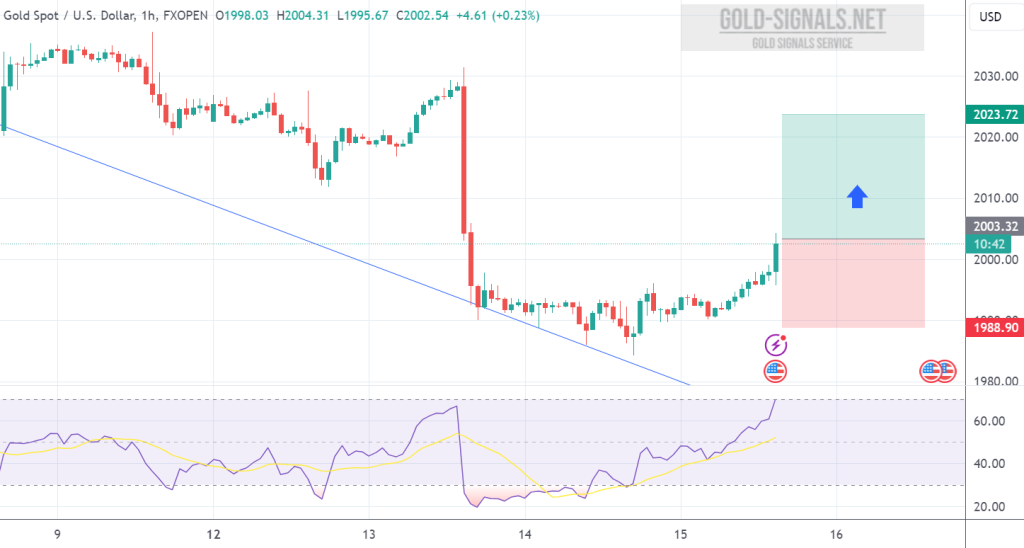
BUY at 2003.50 T/P 1: 2008.50 T/P 2: 2013.50 T/P 3: 2018.50 T/P 4: 2023.50* S/L: 1983.50 #XAUUSD hit T/P 4 Price with +2.000 PIPs…
Oscillators indicate mixed signals, with a predominant buying inclination due to positive MACD and Momentum indicators. Moving averages suggest conflicting sentiments, with short-term averages signaling…
Based on the provided technical analysis of XAU/USD Oscillators Summary: Buy: MACD Level, Momentum. Sell: Commodity Channel Index. Direction: Mixed signals, leaning slightly towards…