Technical Analysis for XAU/USD: OSCILLATORS Summary: BUY: MACD Level SELL: Momentum Direction: Neutral to Slightly Bearish MOVING AVERAGES Summary: BUY: All Moving Averages SELL: Hull…
Author: GOLD Signals TEAM
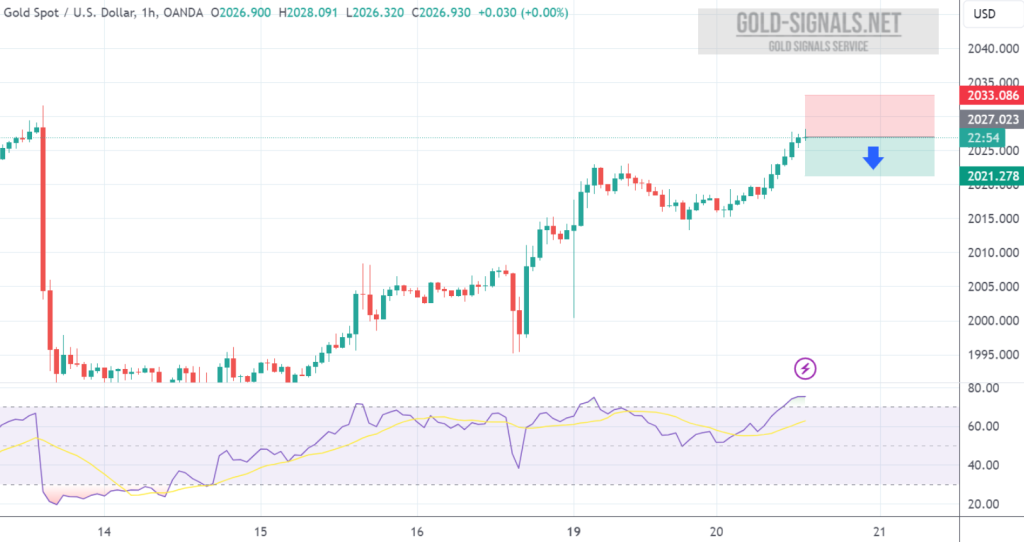
SELL at 2026.00 T/P: 2021.00 S/L: 2031.00 #XAUUSD hit T/P Price with +500 PIPs Profit
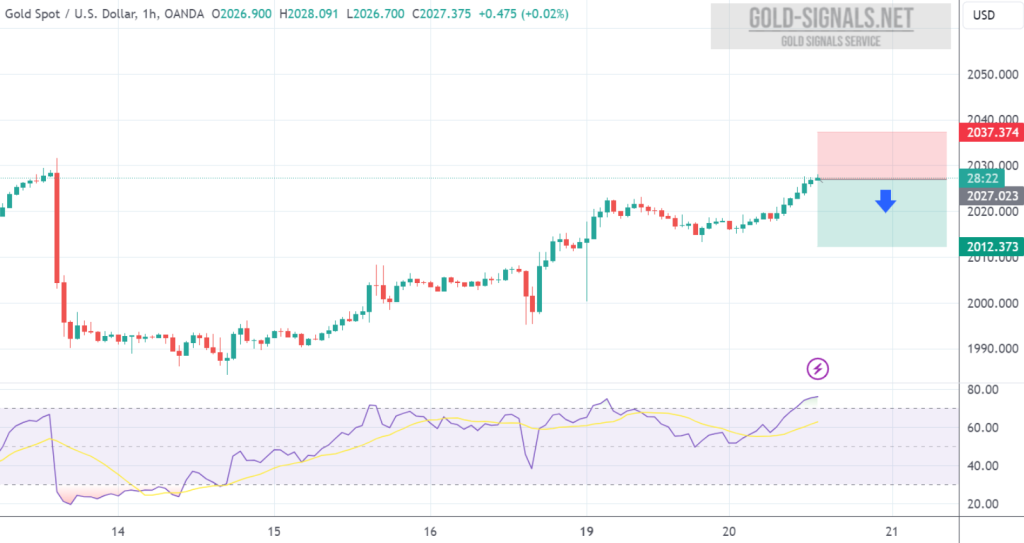
SELL at 2026.00 T/P 1: 2021.00 T/P 2: 2016.00 T/P 3: 2011.00* S/L: 2042.00 #XAUUSD hit T/P 2 Price with +1.000 PIPs Profit
GOLD’s 1-hour chart presents a mixed outlook. While pivot points indicate a buying bias, oscillators and some moving averages signal potential selling pressure. Conflicting signals…
Technical Analysis for XAU/USD (Gold Market) – 1-Hour Chart Oscillators Summary: Buy: MACD Level (12, 26), Momentum (10) Sell: Commodity Channel Index (20) Market…
GOLD exhibits a mixed outlook on the 1-hour chart. While pivot points indicate a buying bias, oscillators and certain moving averages suggest potential selling pressure.…
Technical Analysis for XAU/USD (Gold Market) – 1-Hour Chart Oscillators Summary: Buy: Momentum (10) Sell: MACD Level (12, 26) Market Direction According to Oscillators:…
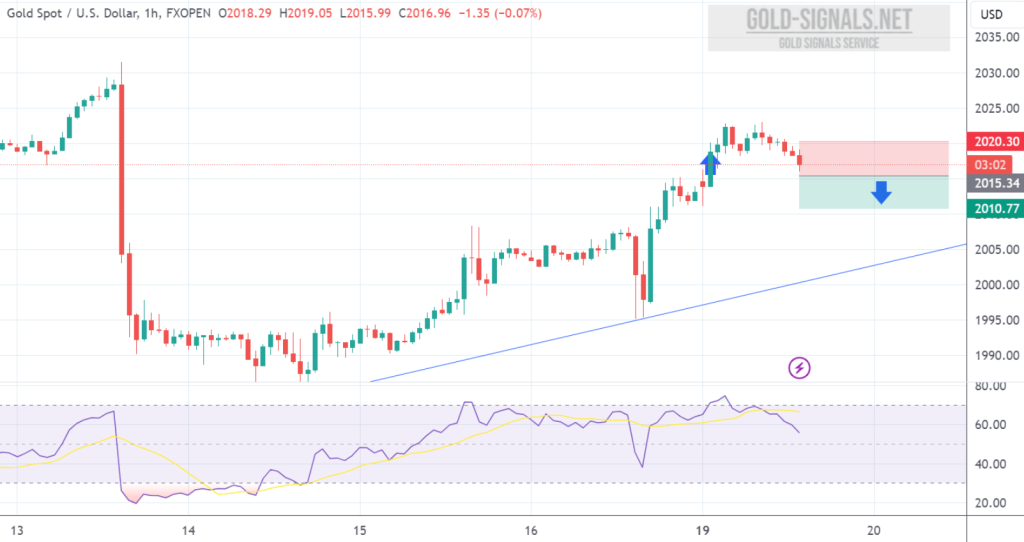
SELL at 2015.00 T/P: 2010.00 S/L: 2020.00 #XAUUSD hit S/L Price with -500 PIPs Loss
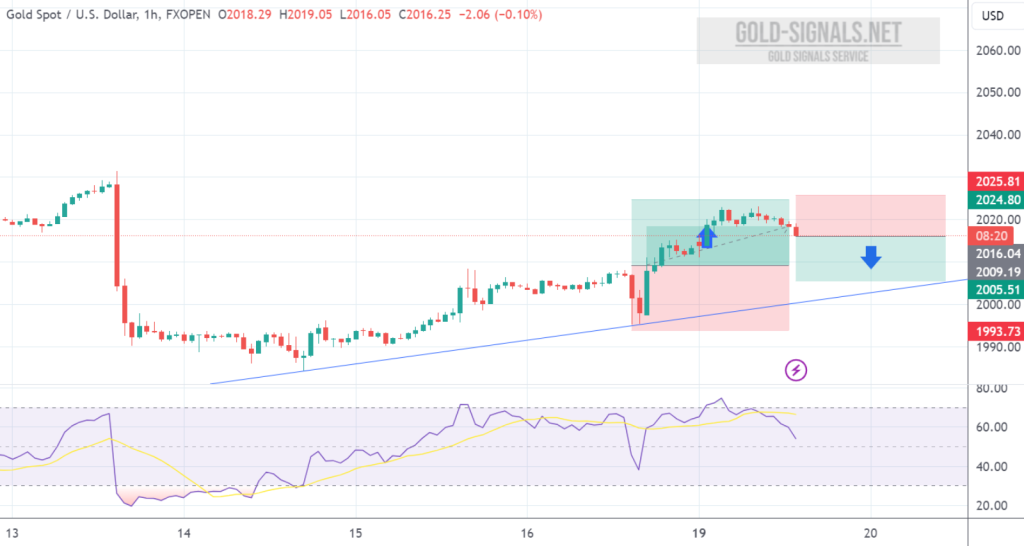
SELL at 2015.00 T/P 1: 2010.00 T/P 2: 2005.00 S/L: 2025.00 Focus on T/P 1, where we can make a decision to close the signal…
GOLD presents a mixed outlook on the 1-hour chart. While pivot points signal a buying bias, oscillators lean towards selling pressure, with momentum and MACD…