At present, XAU/USD’s outlook is uncertain. Mixed signals from oscillators, moving averages, and pivot points make predicting market direction challenging. While some indicators suggest buying…
Author: GOLD Signals TEAM
Technical Analysis for XAU/USD (Gold Market) Current Price: 2026.75 at 13:39 PM OSCILLATORS: Buy: Momentum, MACD Level Neutral: Relative Strength Index, Stochastic %K, Commodity…
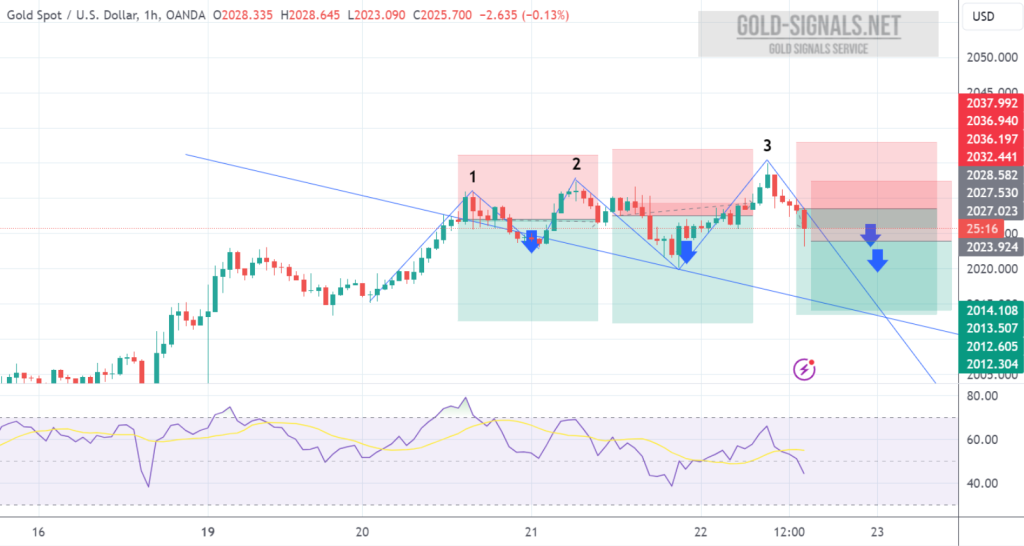
SELL at 2025.00 T/P 1: 2020.00 T/P 2: 2015.00 S/L: 2034.00 #XAUUSD hit T/P Price with +500 PIPs Profit
SELL at 2027.50 T/P 1: 2022.50 S/L: 2036.50 #XAUUSD hit T/P Price with +500 PIPs Profit
SELL at 2027.50 T/P 1: 2022.50 T/P 2: 2017.50 T/P 3: 2012.50 S/L: 2042.50 #XAUUSD hit T/P 2 Price with +1.000 PIPs Profit
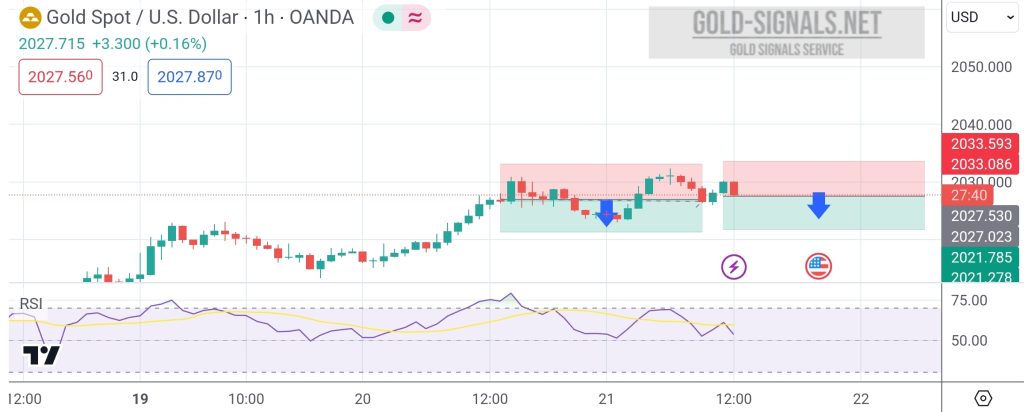
Technical Analysis for XAU/USD (Gold Market) – 1-hour Chart Summary: XAU/USD is exhibiting a neutral outlook with conflicting signals across oscillators, moving averages, and pivot…
The price accurately followed my previous analysis. It reached the Take Profit (TP) level. On the 1-hour timeframe, XAUUSD established a range and broke out…

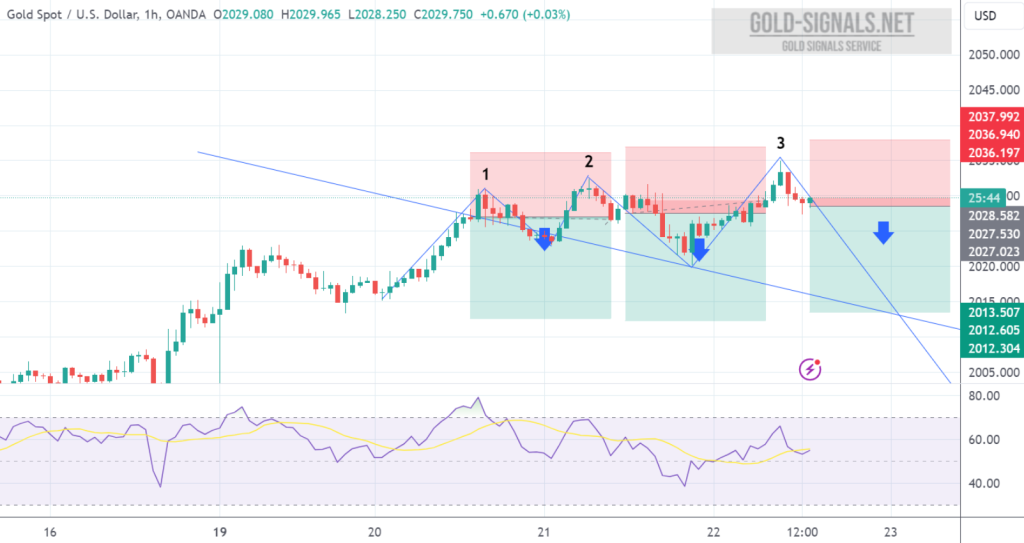
SELL at 2026.00 T/P: 2021.00 S/L: 2036.00 #XAUUSD hit T/P Price with +500 PIPs Profit
SELL at 2026.00 T/P 1: 2021.00 T/P 2: 2016.00 T/P 3: 2011.00 S/L: 2041.00 #XAUUSD hit T/P 2 Price with +1.000 PIPs Profit
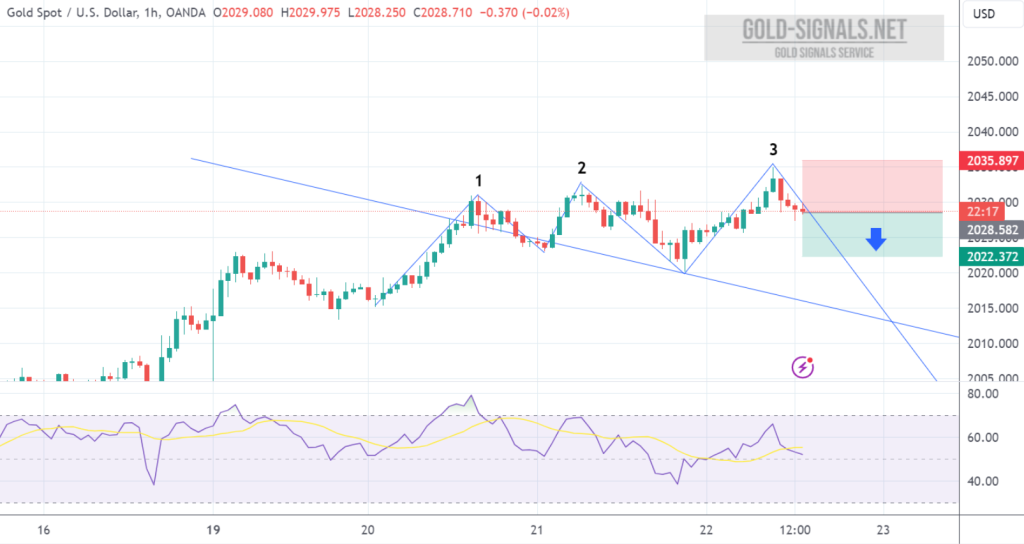
It’s anticipated that there will be an effort to rectify prices, with a trial of the resistance zone around the 2025 mark. Additionally, there’s an…