Market dynamics are displaying a mixed trend in metal prices, with base metals showcasing resilience while gold experiences a decline, amidst investors’ apprehension preceding the…
Author: GOLD Signals TEAM
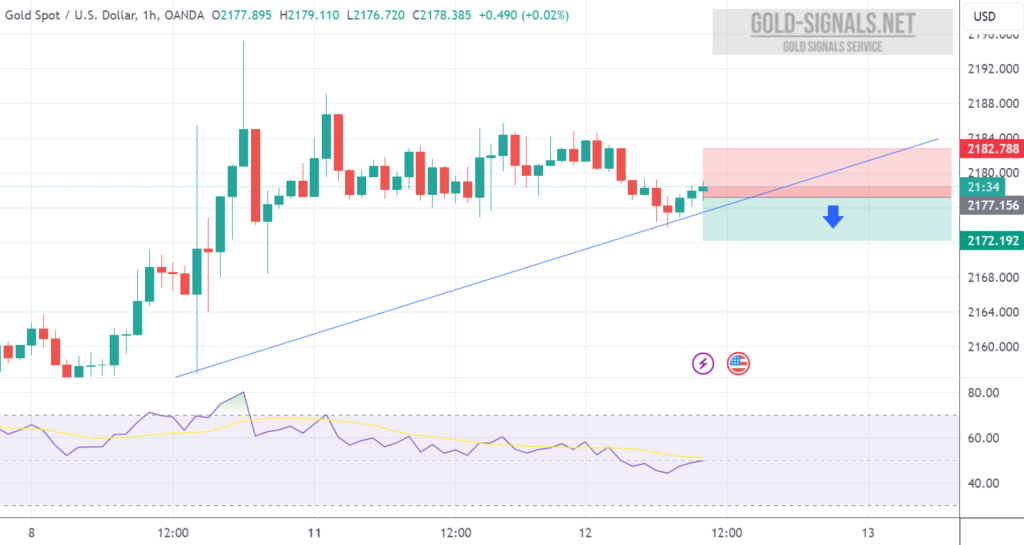
SELL at 2177.00 T/P: 2172.00 S/L: 2182.00 #XAUUSD hit T/P Price with +500 PIPs Profit
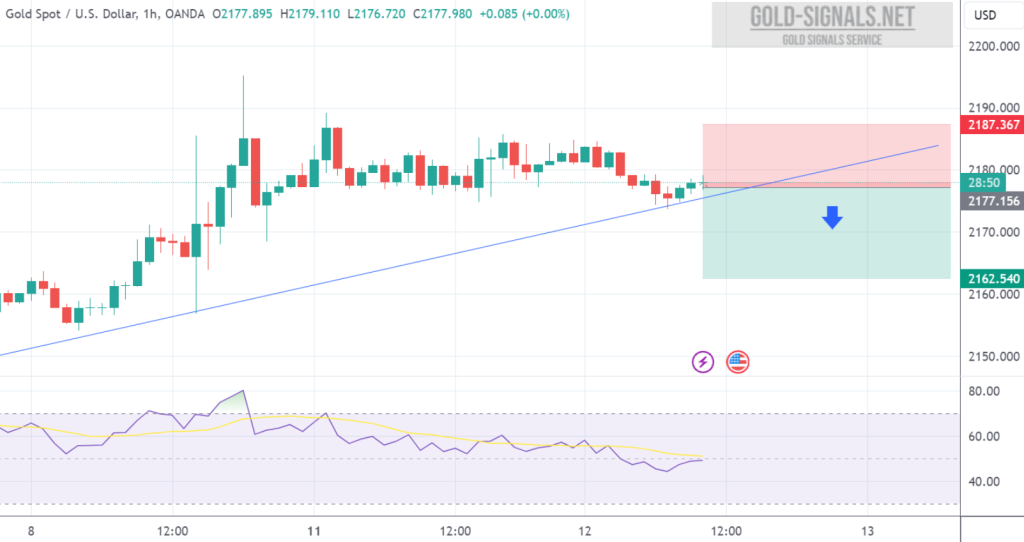
SELL at 2176.00 T/P 1: 2171.00 T/P 2: 2166.00 T/P 3: 2161.00 S/L: 2186.00 #XAUUSD hit T/P 3 Price with +1.500 PIPs Profit
Technical Analysis for XAU/USD (Gold Market) Oscillators Summary: BUY: Momentum (10) SELL: MACD Level (12, 26) Market Direction: The oscillators are mixed, leaning slightly towards…
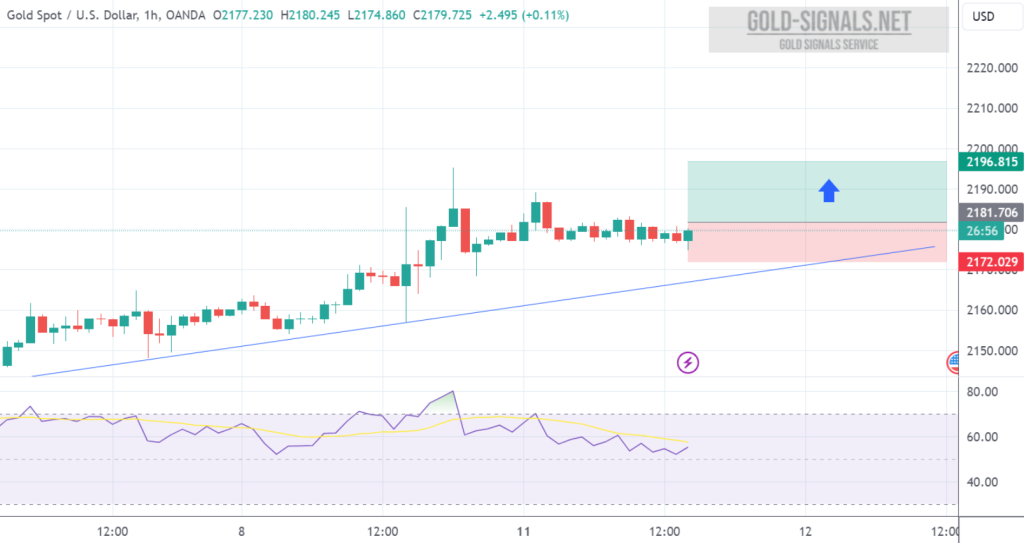
An additional indication favoring an increase in XAU/USD rates would be the examination of the support line on the relative strength index (RSI). Another signal…
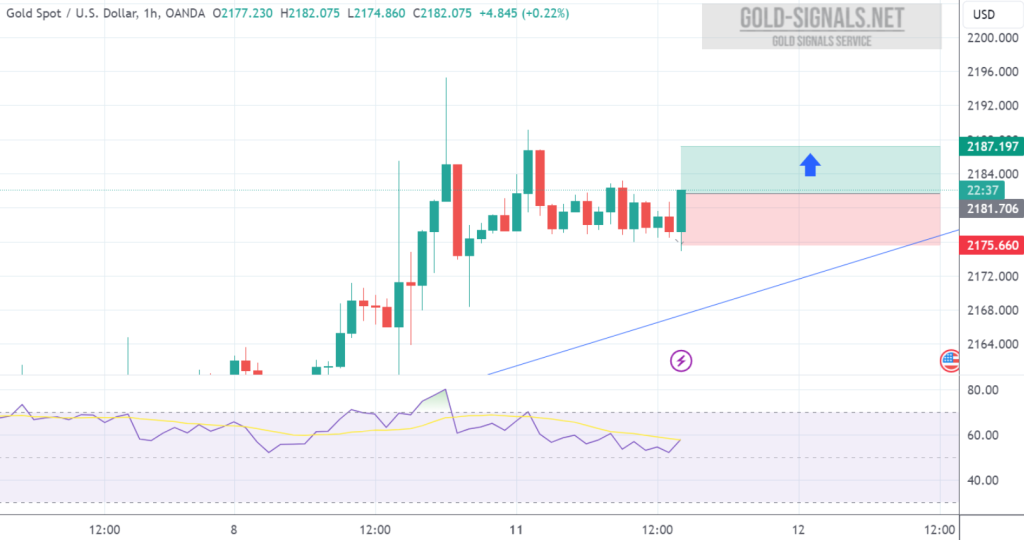
BUY at 2182.50 T/P: 2187.50 S/L: 2177.50 #XAUUSD hit S/L Price with -500 PIPs Loss
BUY at 2181.00 T/P 1: 2186.00 T/P 2: 2191.00 T/P 3: 2196.00 S/L: 2171.00 #XAUUSD hit S/L Price with -1.000 PIPs Loss
Technical Analysis for XAU/USD (Gold Market) – 1 Hour Chart Oscillators Summary: Buy: None Sell: Momentum (10), MACD Level (12, 26) Neutral: Relative Strength…
The market has formed an inside bar. The price is moving sideways within the range of the 4-hour candle. Looking at the 1-hour timeframe, it…
Another indication supporting a potential uptrend in Gold during the trading week spanning March 11th to March 15th, 2024, would be a bounce off the…